執行計畫是什麼,又不是什麼#
執行計畫(execution plan)是觀察優化器決策的最佳窗口——它記錄查詢使用的 join 種類、用了哪些索引、用法是什麼。
執行計畫不是效能量測。計畫上的「成本」永遠是估算值(estimate),不是實際運行的測量結果。
執行計畫在所有 SQL Server 平台通用:Azure SQL Database、SQL Server 2025、AWS RDS、Azure Managed Instance 看到的格式都一樣,只是新功能會以新運算子(operator)型式出現。
Estimated vs. Actual:常見誤解#
SSMS 把計畫分成「Estimated」與「Actual」兩個按鈕,但這是 歷史遺留的命名。
執行計畫只有一種。所謂「Actual Plan」其實只是「執行計畫 + 執行階段量測(runtime metrics)」。
從 DMV、Extended Events、Query Store 拿出來的計畫,與「Actual Plan」對同一查詢(沒發生 recompile)的 計畫本身完全一致——差別只在有沒有附加 runtime metrics。
附加的 runtime metrics 包含:
- 等待統計(wait statistics)
- 查詢時間
- 實際列數(actual row counts)
- 各運算子的實際執行次數
擷取 runtime metrics 同時 量測查詢效能會互相干擾。抓計畫就不要量效能、量效能就不要抓計畫。
擷取執行計畫的四種方法#
1. SQL Server Management Studio(SSMS)#
- 不執行查詢只取計畫:工具列「Display estimated execution plan」按鈕,或
Ctrl + L - 執行查詢並附加 runtime metrics:工具列「Include actual execution plan」按鈕,或
Ctrl + M

Figure 4-1: SQL Editor toolbar with the Display estimated execution plan button

Figure 4-3: SQL Editor toolbar with the Include actual execution plan
同時 highlight 多條語句會 每條 都產出一個計畫。要單看一個查詢,先選取再按按鈕。
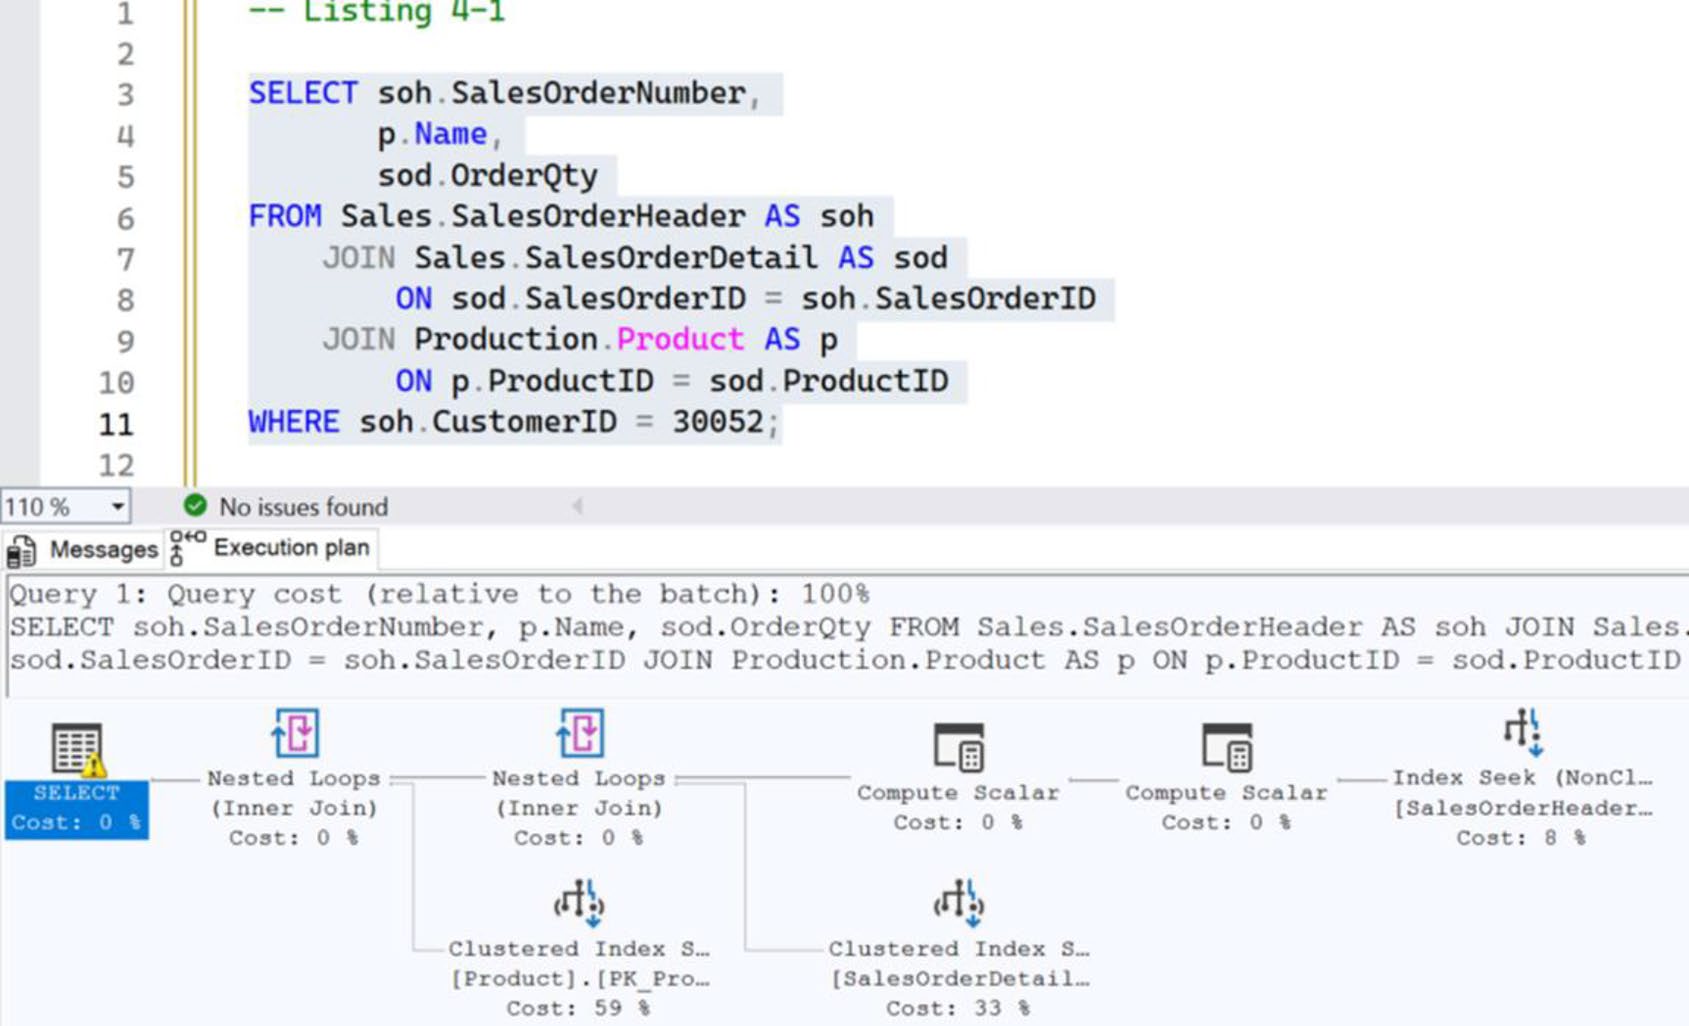
Figure 4-2: Highlighted query and the execution plan
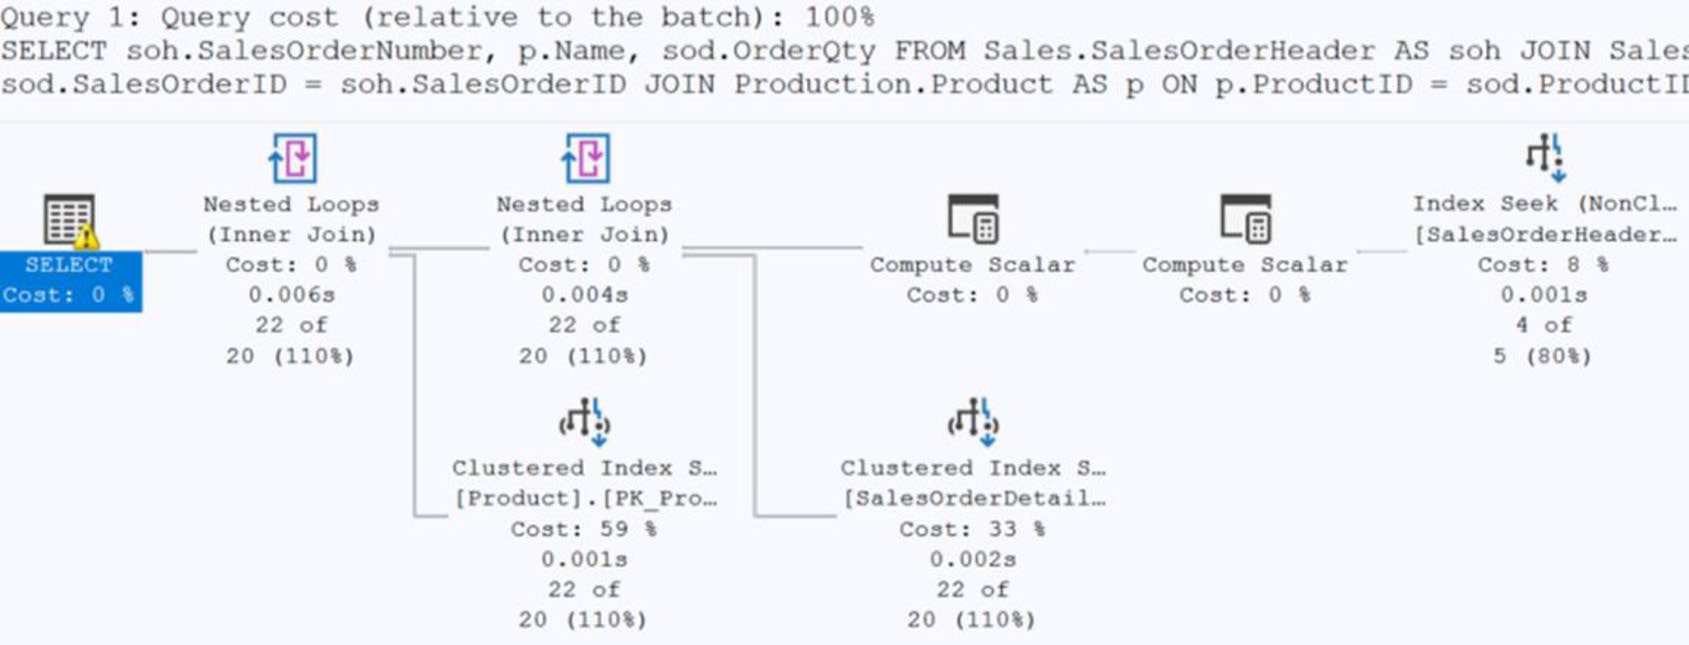
Figure 4-4: However, the results tab will be the one open by
2. Dynamic Management Views#
SELECT dest.text,
       deqp.query_plan,
       deqs.execution_count,
       deqs.total_elapsed_time,
       deqs.last_elapsed_time
FROM sys.dm_exec_query_stats AS deqs
    CROSS APPLY sys.dm_exec_query_plan(deqs.plan_handle) AS deqp
    CROSS APPLY sys.dm_exec_sql_text(deqs.sql_handle) AS dest
WHERE dest.text LIKE 'SELECT ...';
query_plan 在結果中顯示為可點開的 XML,點下去 SSMS 會直接開啟為圖形計畫——但不會有 runtime metrics,因為 plan cache 不存量測值。

Figure 4-5: Results of querying the plan cache with a DMV
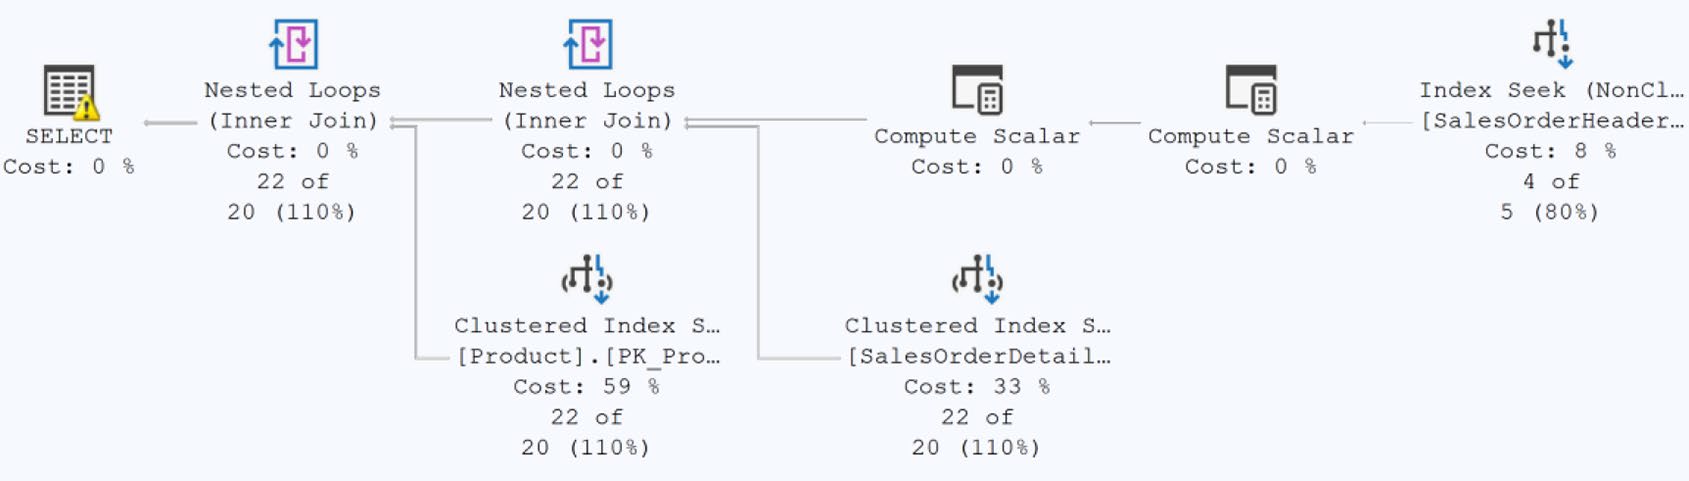
Figure 4-6: An execution plan with runtime metrics
XML 有巢狀深度上限(nesting limit)。極大計畫可能無法用
sys.dm_exec_query_plan,要改用sys.dm_exec_text_query_plan,把結果存成*.sqlplan檔再用 SSMS 開。
取得「最近一次 actual plan」#
啟用輕量級 statistics profiling:
ALTER DATABASE SCOPED CONFIGURATION SET LAST_QUERY_PLAN_STATS = ON;然後使用 sys.dm_exec_query_plan_stats(plan_handle)。
不保證每次都拿得到:
- 計畫必須還在
sys.dm_exec_cached_plans裡 - 過於簡單的查詢可能只回傳根運算子
- 計畫被踢出快取就一起消失
3. Query Store#
SELECT qsq.query_id,
       qsq.query_hash,
       CAST(qsp.query_plan AS XML) AS QueryPlan
FROM sys.query_store_query AS qsq
    JOIN sys.query_store_plan AS qsp
        ON qsp.query_id = qsq.query_id
    JOIN sys.query_store_query_text AS qsqt
        ON qsqt.query_text_id = qsq.query_text_id
WHERE qsqt.query_sql_text LIKE 'SELECT ...';
Query Store 把 plan XML 存在
VARCHAR(MAX)欄位,需要CAST成 XML 才能在 SSMS 開啟。Query Store 也不存單次 runtime metrics——它記錄的是聚合結果。

Figure 4-7: Retrieving an execution plan from the Query Store
4. Extended Events#
可用的事件:
query_post_compilation_showplan:編譯後(不含 runtime metrics)query_pre_execution_showplan:優化後、執行前query_post_execution_plan_profile(SQL Server 2017+):使用輕量級 profiling,含 runtime metricsquery_post_execution_showplan:執行後,含 runtime metrics
用 XE 抓計畫成本不低。務必加上嚴格的 Predicate(如資料庫名稱、時間下限)以縮小範圍。
需要 runtime metrics 時,優先用 query_post_execution_plan_profile,它的負擔最低。
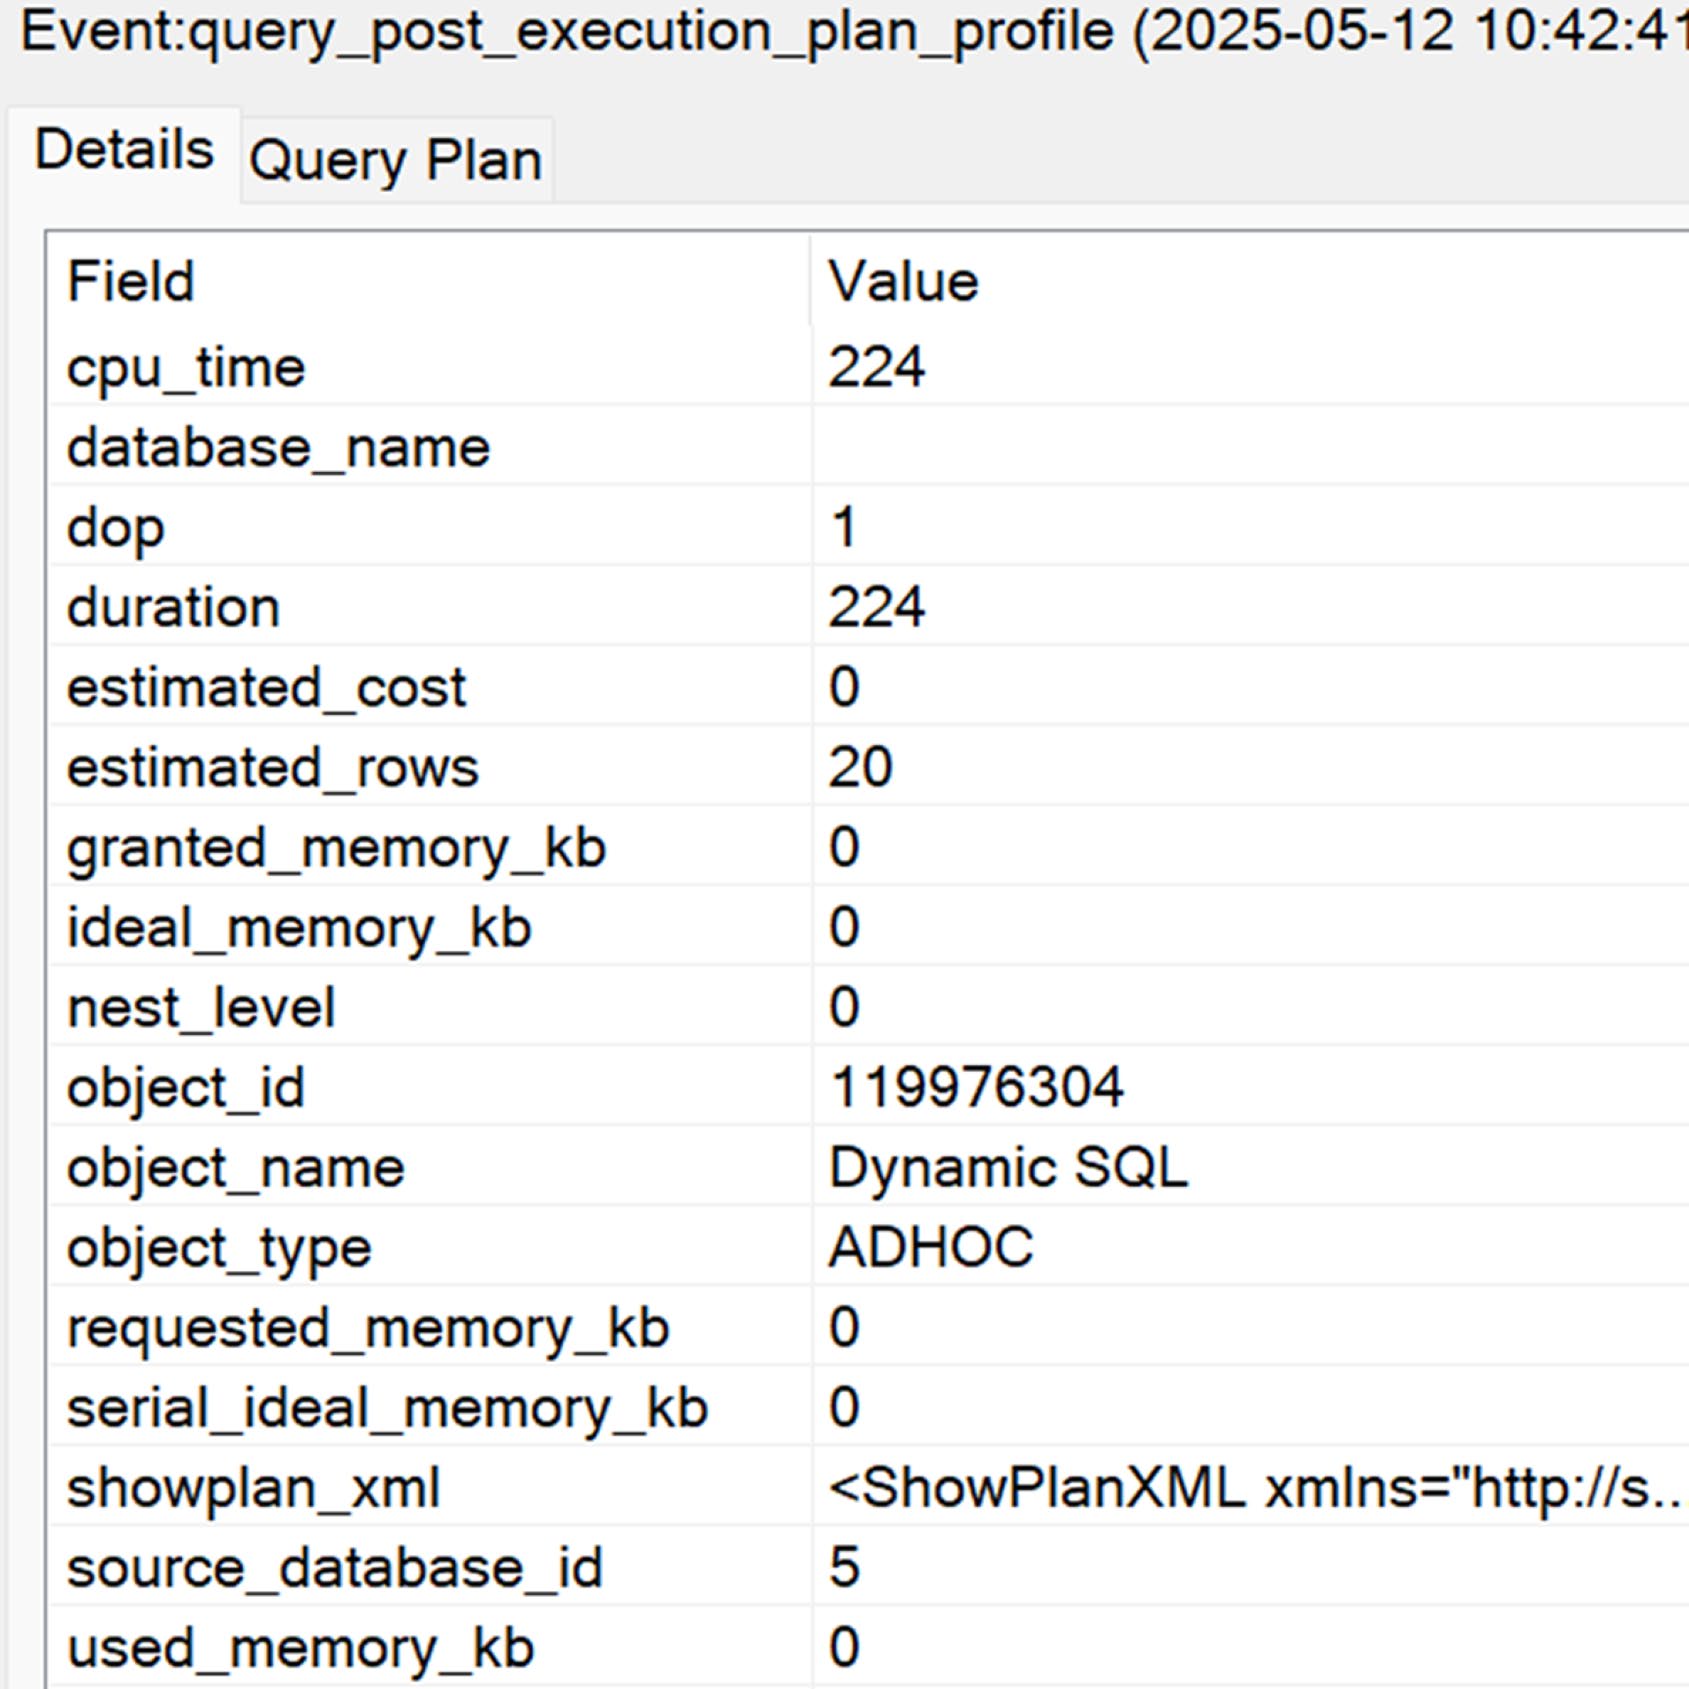
Figure 4-8: Extended Event fields after capturing an execution plan
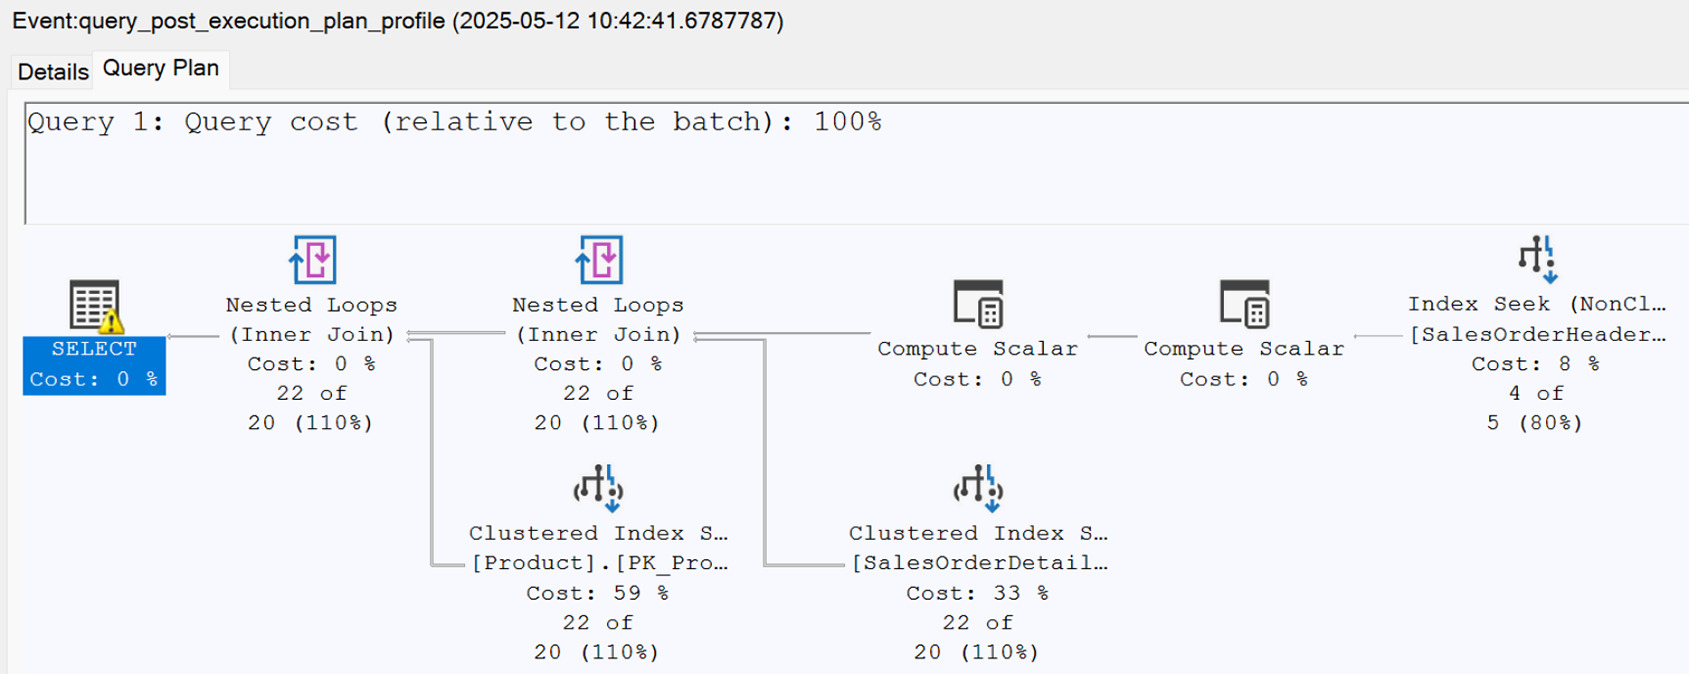
Figure 4-9: The execution plan inside of Extended Events
執行計畫裡有什麼#
運算子(operators / iterators)#
每個圖示代表一個運算子(例如 Nested Loops),運算子也叫 iterator(迭代器),因為它們會一列一列或一批一批 iterate 處理資料。

Figure 4-10: The icon representing the Nested Loops operator
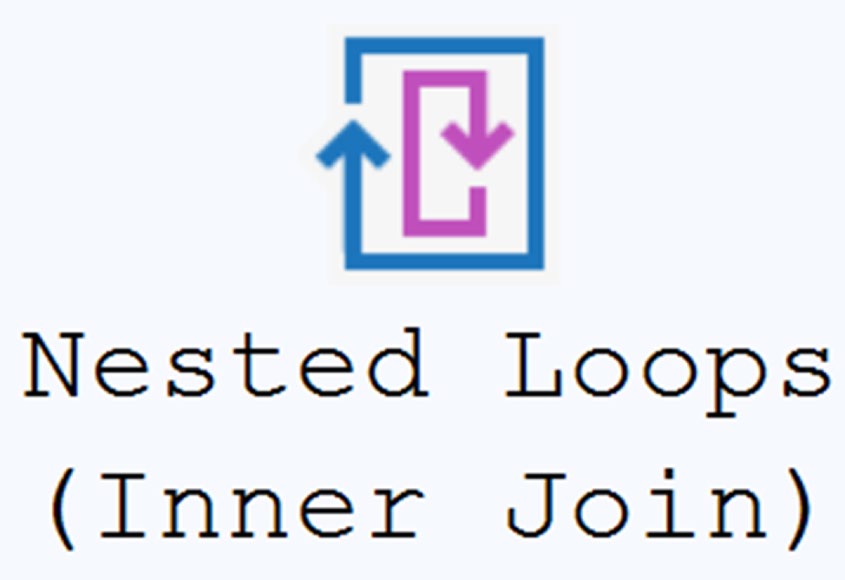
Figure 4-11: The icon plus the name of the operator and the action it represents
每個運算子下方會顯示:
- 邏輯名稱與實體動作
- Estimated Cost:CPU、記憶體、I/O 估算的綜合值(始終是估算)
- 含 runtime metrics 時會多顯示時間、實際列數與估算列數比
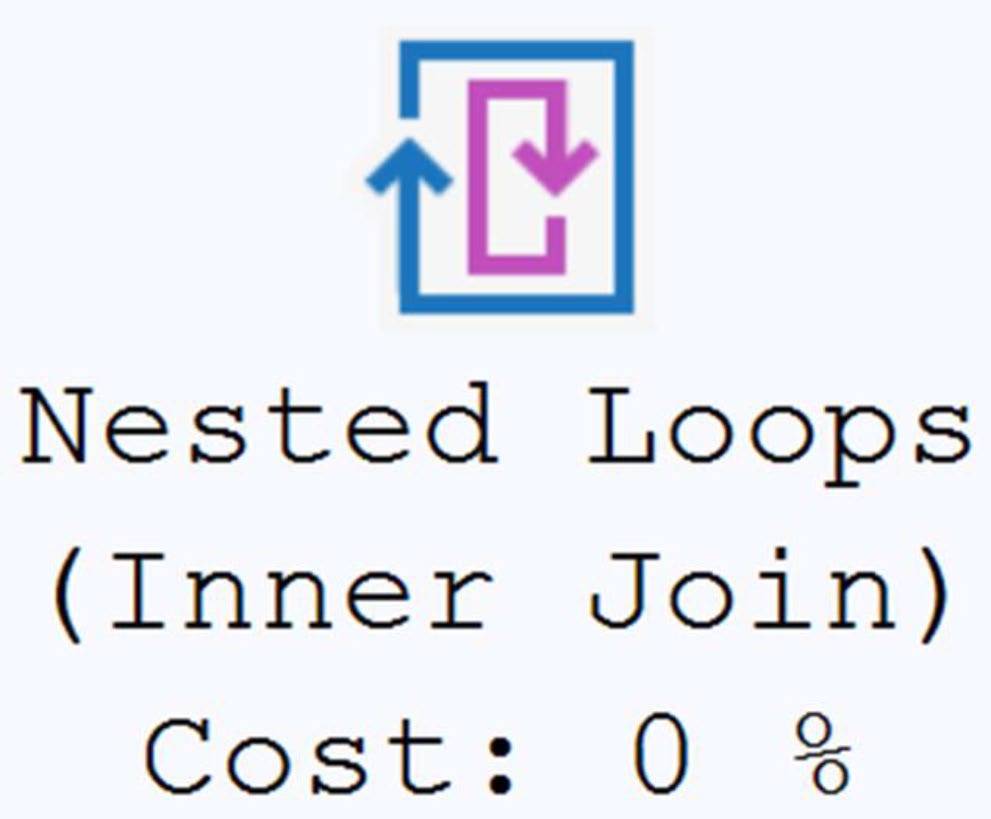
Figure 4-12: The estimated cost of the operator
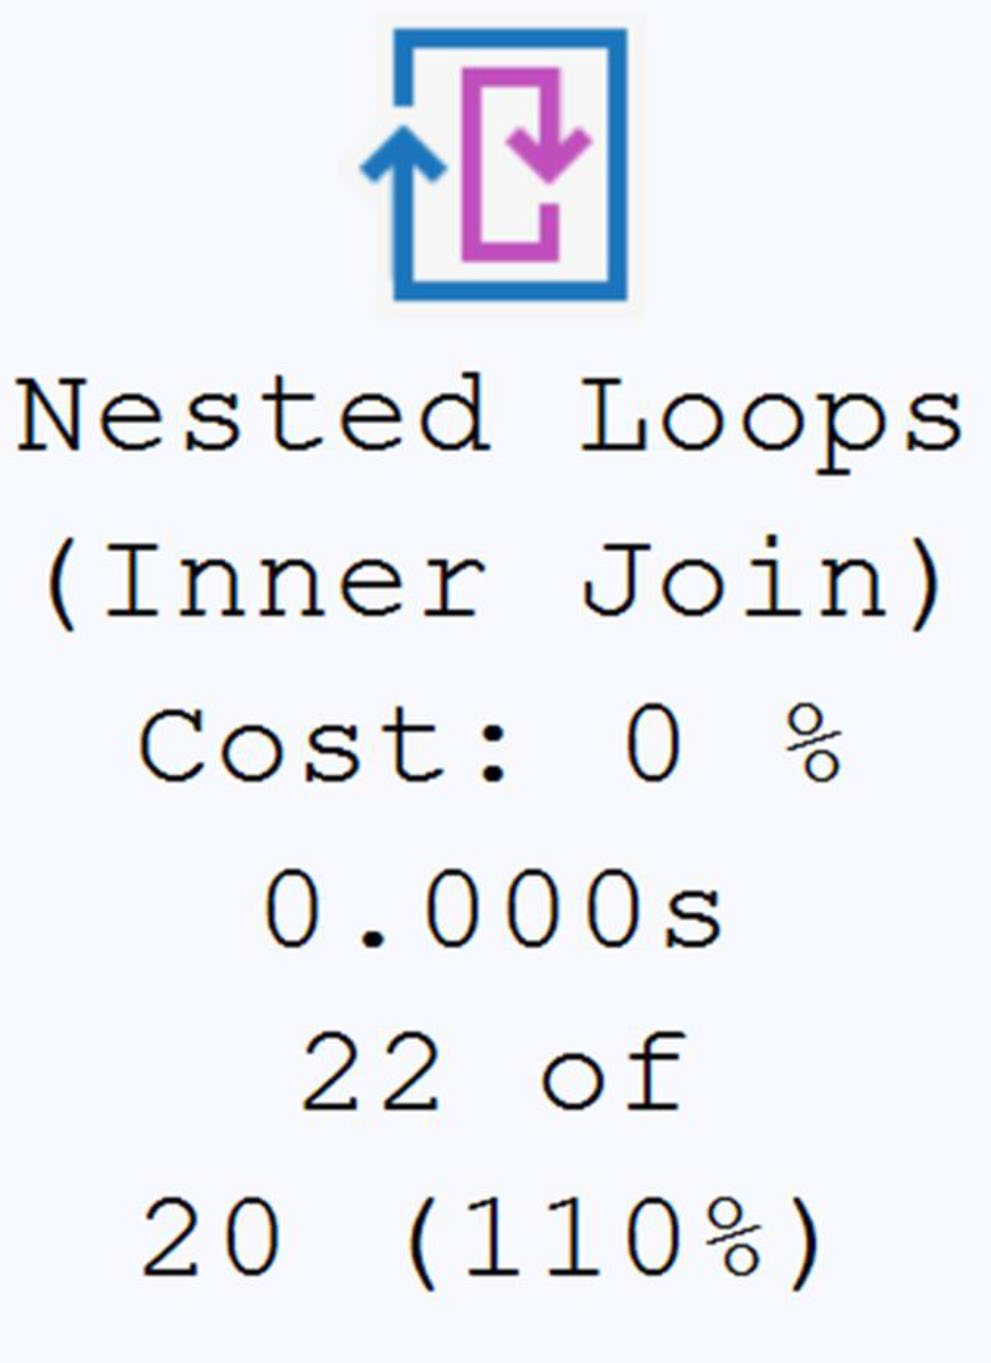
Figure 4-13: The added values from the runtime metrics
Pipes(資料流)#
運算子之間的箭頭代表資料流,箭頭粗細 = 資料量大小。作者習慣稱之為 pipes(管路)。
- 粗變細:晚期過濾——可能需要索引或改寫程式
- 細變粗:資料被放大——通常意味更多 I/O、更多記憶體
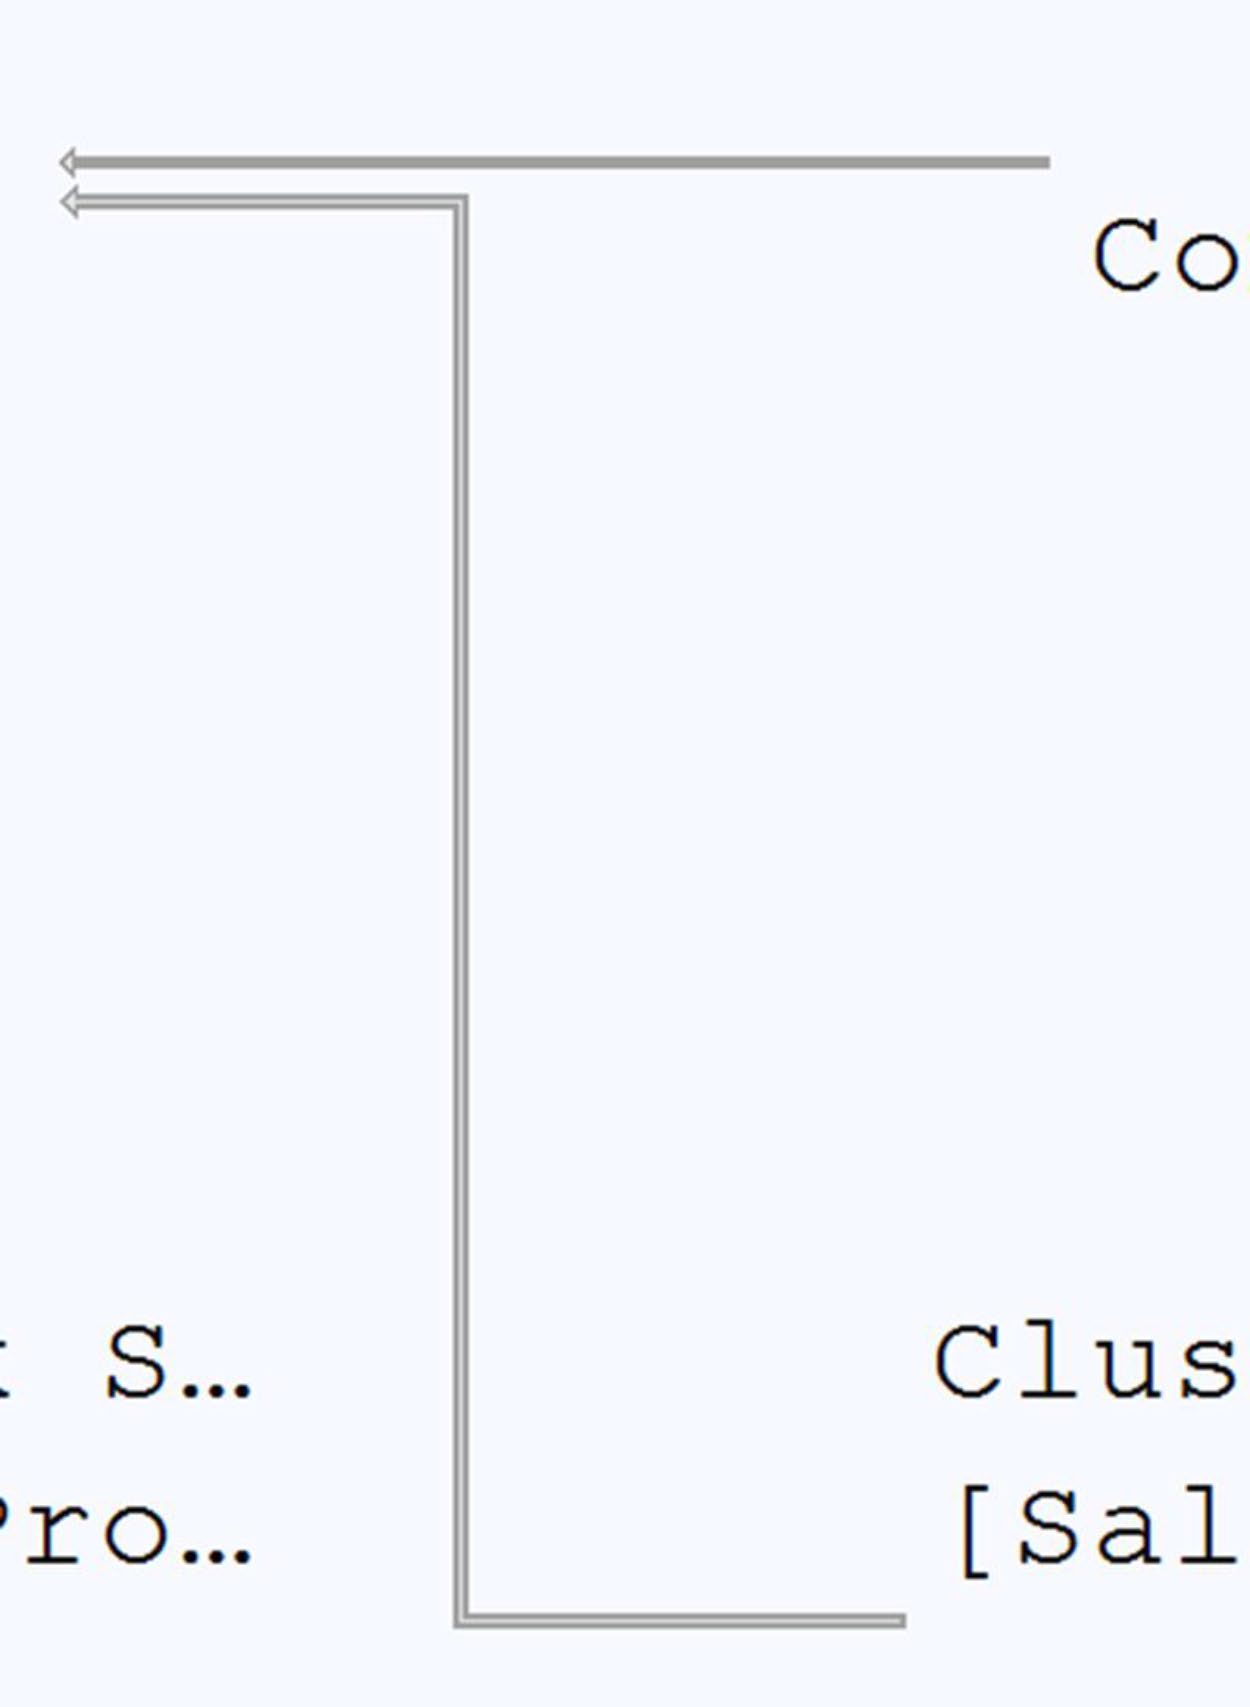
Figure 4-14: Pipes representing data flow connect operators together
Tooltip vs. Properties#
- Tooltip:滑鼠 hover 跳出,內容簡短,作者覺得「會擋路」
- Properties:右鍵 → Properties(建議釘住),內容最完整
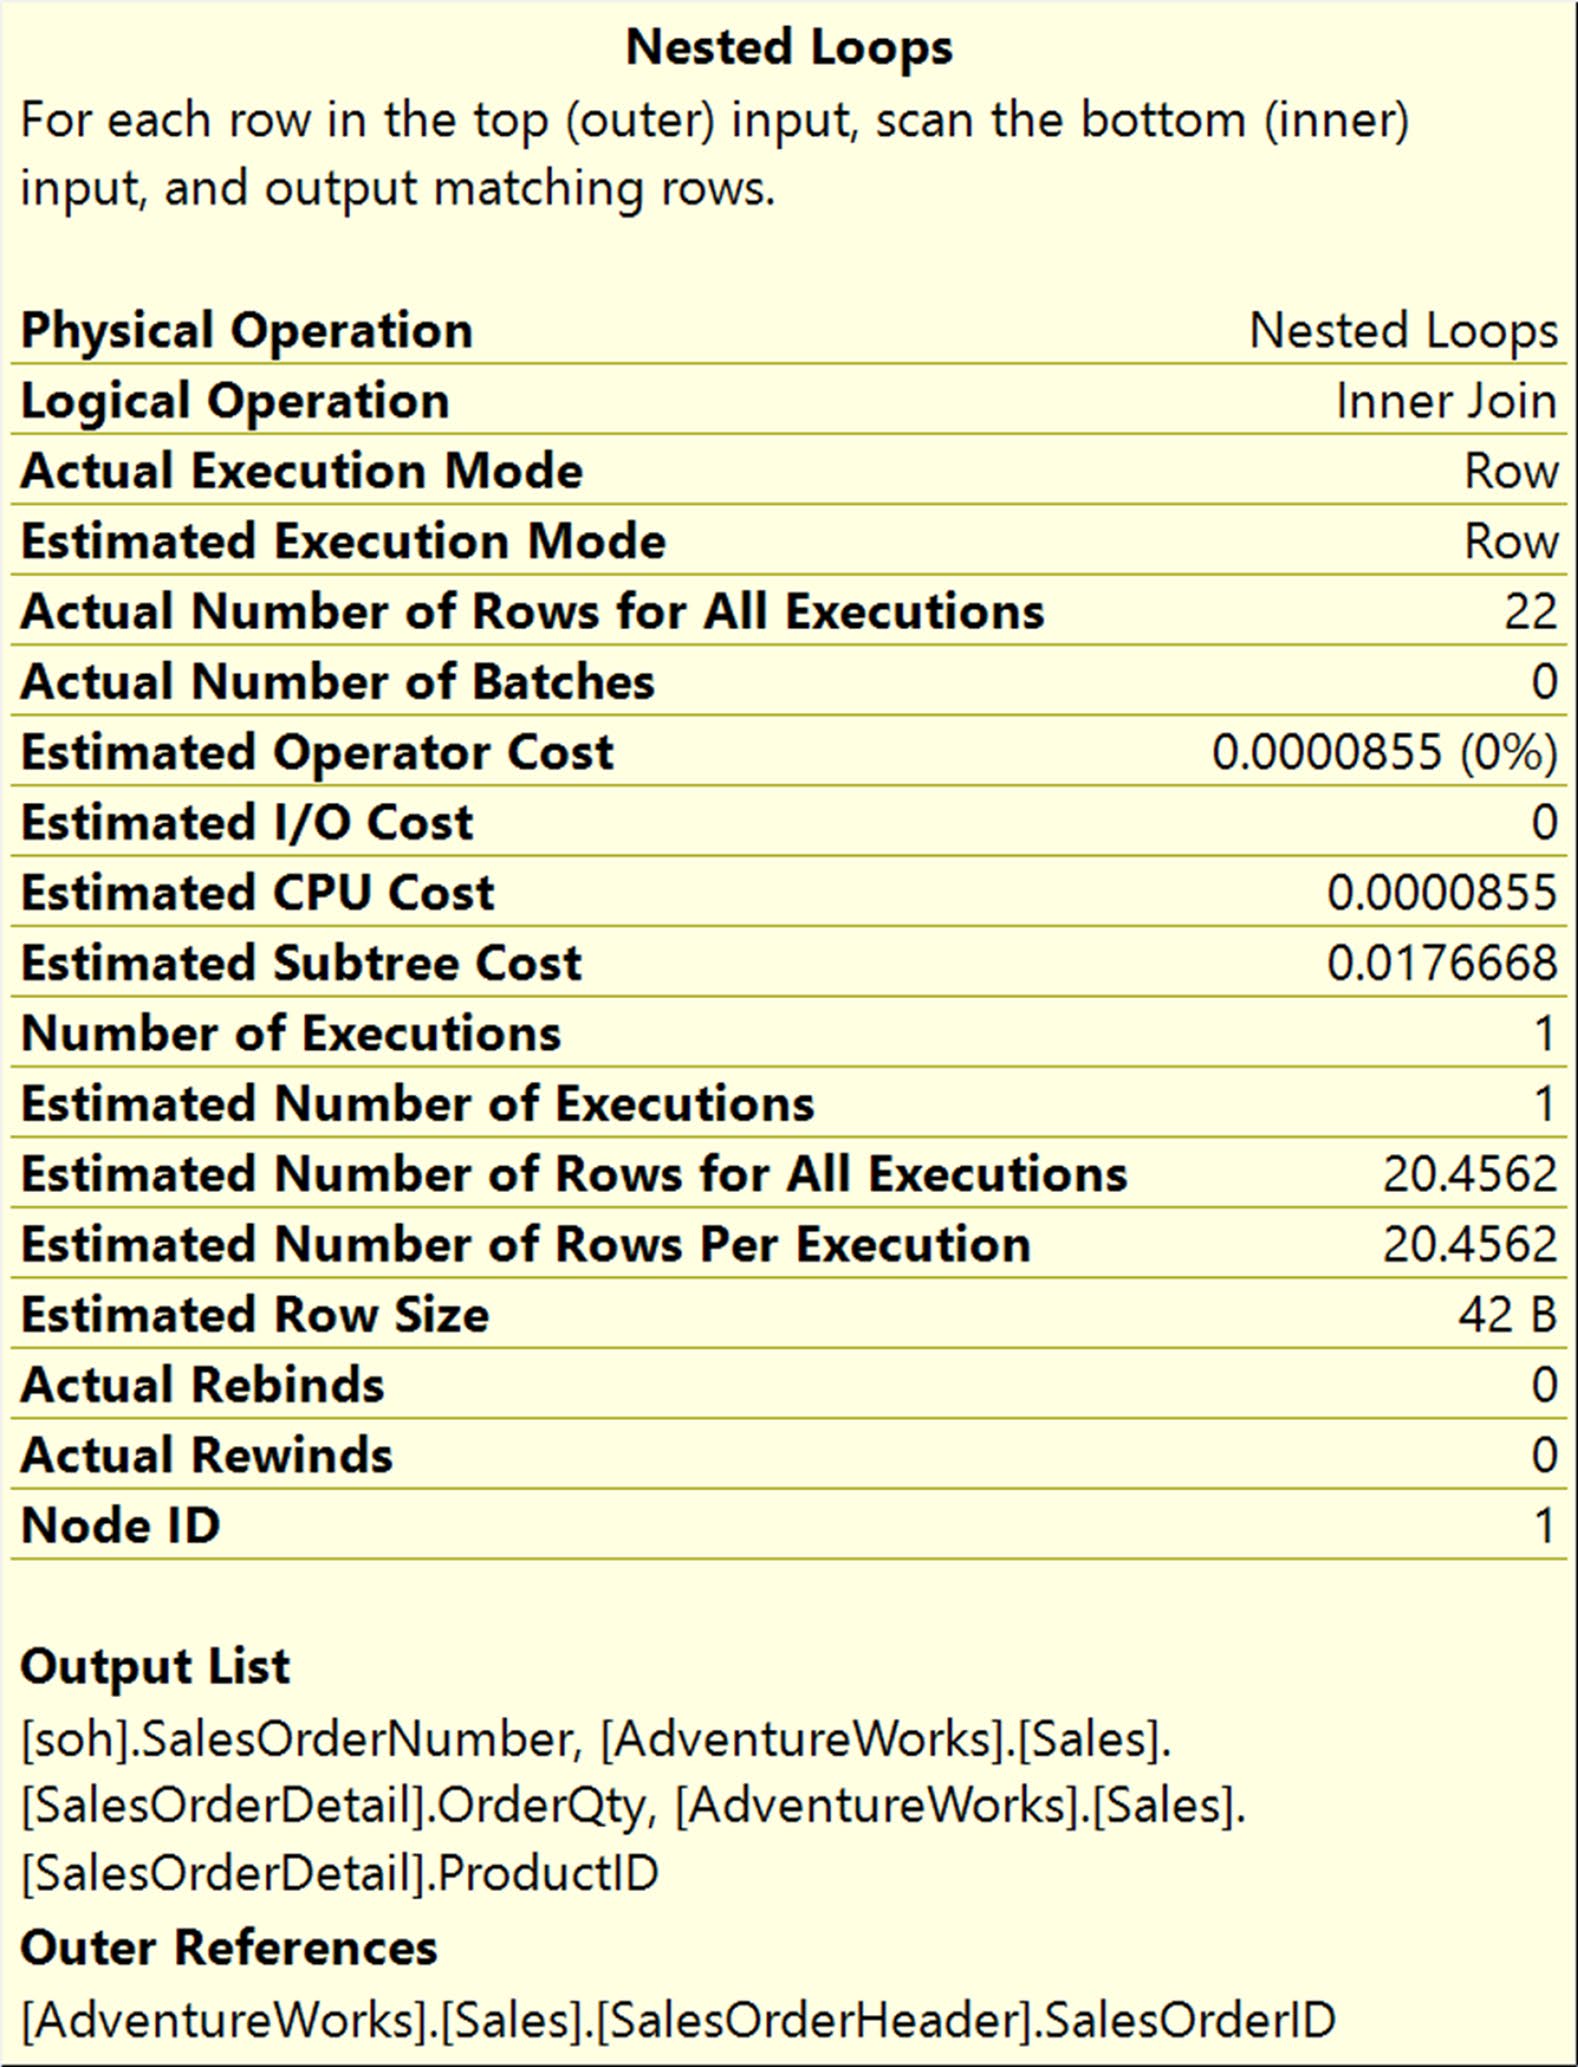
Figure 4-15: The tooltip for the Nested Loops operator
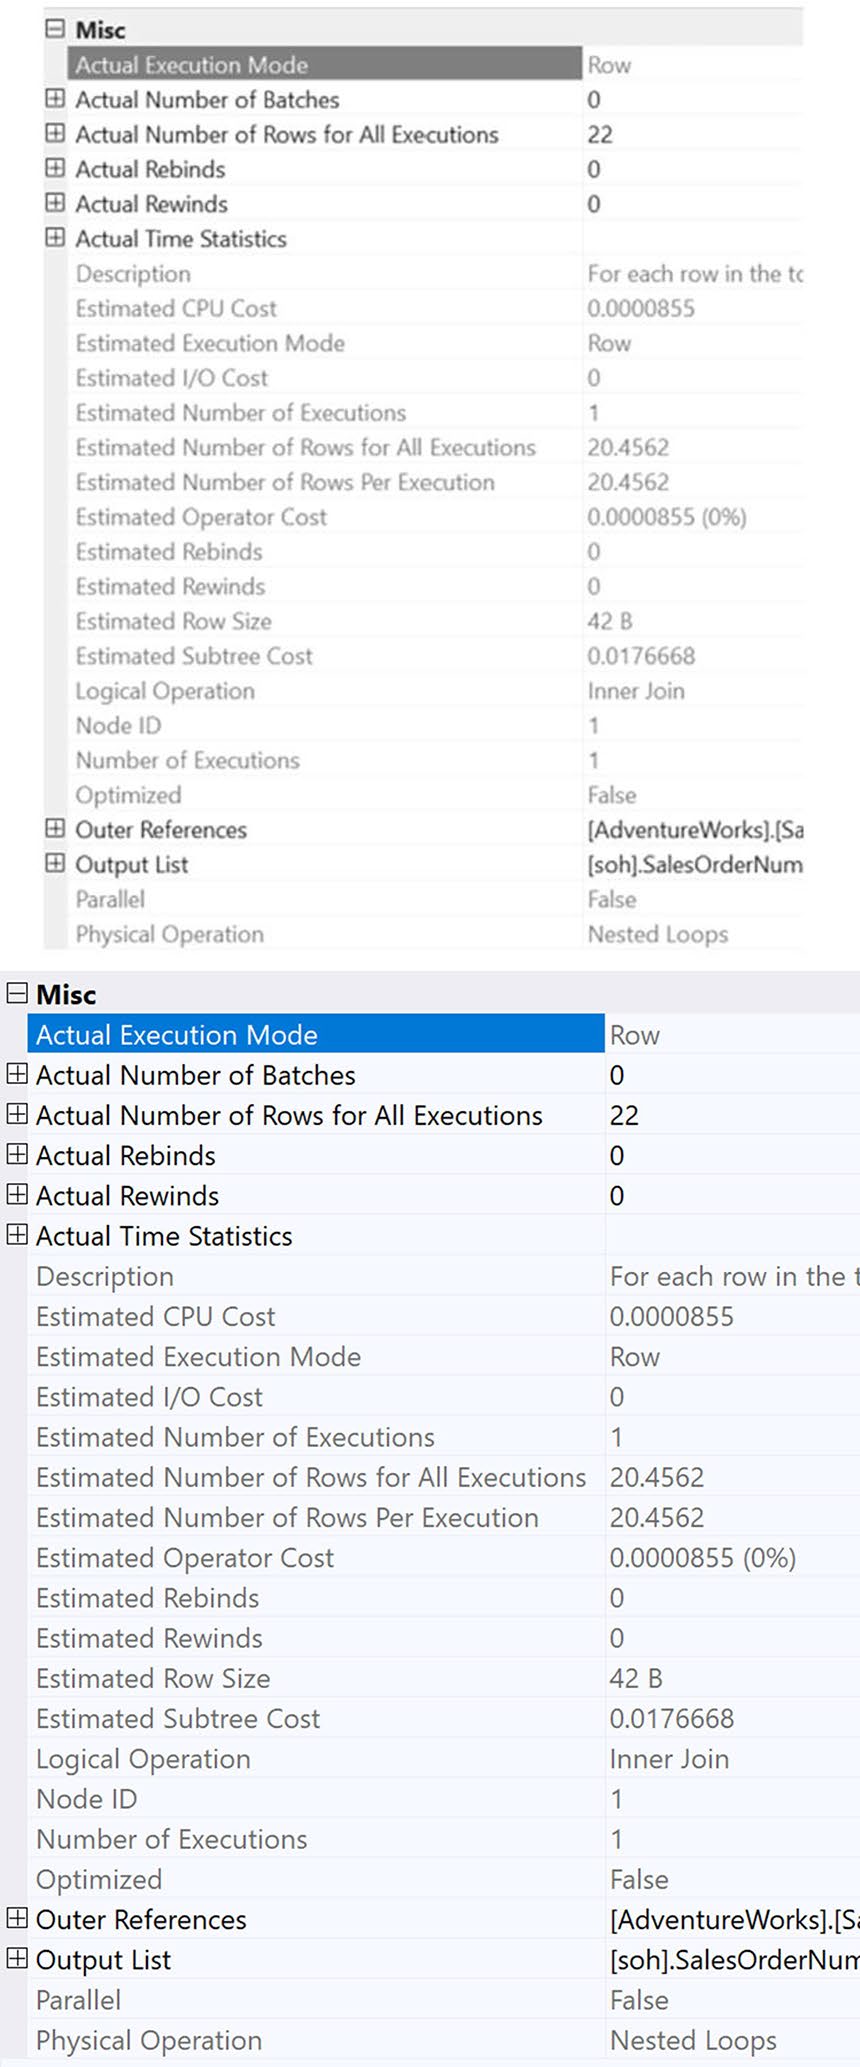
Figure 4-16: Properties of the Nested Loops operator
把 Properties 視窗 pin(釘住) 在 SSMS 內,逐一點選 operator 即可即時看完整屬性。這是作者長期使用的工作流。
計畫頂端資訊#
- 批次中的查詢編號與相對成本
- 查詢文字(可開新視窗看完整版)
- Missing Index Hint(後續章節會詳述)

Figure 4-17: The information at the top of the execution plan
兩種讀計畫方式#
邏輯閱讀:左到右#
從最左側 SELECT / INSERT / UPDATE / DELETE 開始往右讀。
- 最左的 SELECT 其實是 metadata 容器,不是真正的運算子,沒有 NodeID
- 第一個有 NodeID 的運算子才是真正的執行起點(NodeID = 0)

Figure 4-18: Execution plan from Listing 4-1
邏輯閱讀的方向,符合查詢引擎初始化的順序:每個運算子向後方索取資料,直到資料被找到並向前流回。
資料流閱讀:右上到左下#
實際資料流向是從最右上角開始,往左流回。
兩種處理模式:
- Row mode:一次處理一列
- Batch mode:一次處理一批列(後章詳述)
看計畫要看什麼:七大路標#
要逐一檢查每個 operator 的每個屬性既費時也不切實際。Fritchey 建議的「快速路標」:
- 第一個運算子(First Operator):計畫 metadata
- 警告(Warnings):黃色驚嘆號或紅 X
- 最高成本運算子:估算成本最高之處
- 粗 pipes:大量資料移動
- 不認得的運算子:陌生 operator 應引起注意
- Scan:不一定壞,但代表 I/O,常見問題來源
- Estimated vs. Actual 列數差距:差距大代表估算與現實脫節
第一個運算子的關鍵屬性#
- Cached plan size:計畫在記憶體中佔多少
- QueryHash:查詢指紋,可用來找相似查詢
- QueryPlanHash:計畫指紋
- Set Options:ANSI 連線設定(不同 SET 會產出不同計畫)
- MemoryGrantInfo:SQL Server 估算分配給此計畫的記憶體;含 runtime 時還會看到實際使用量
- Warnings:本計畫的全部警告整理在此
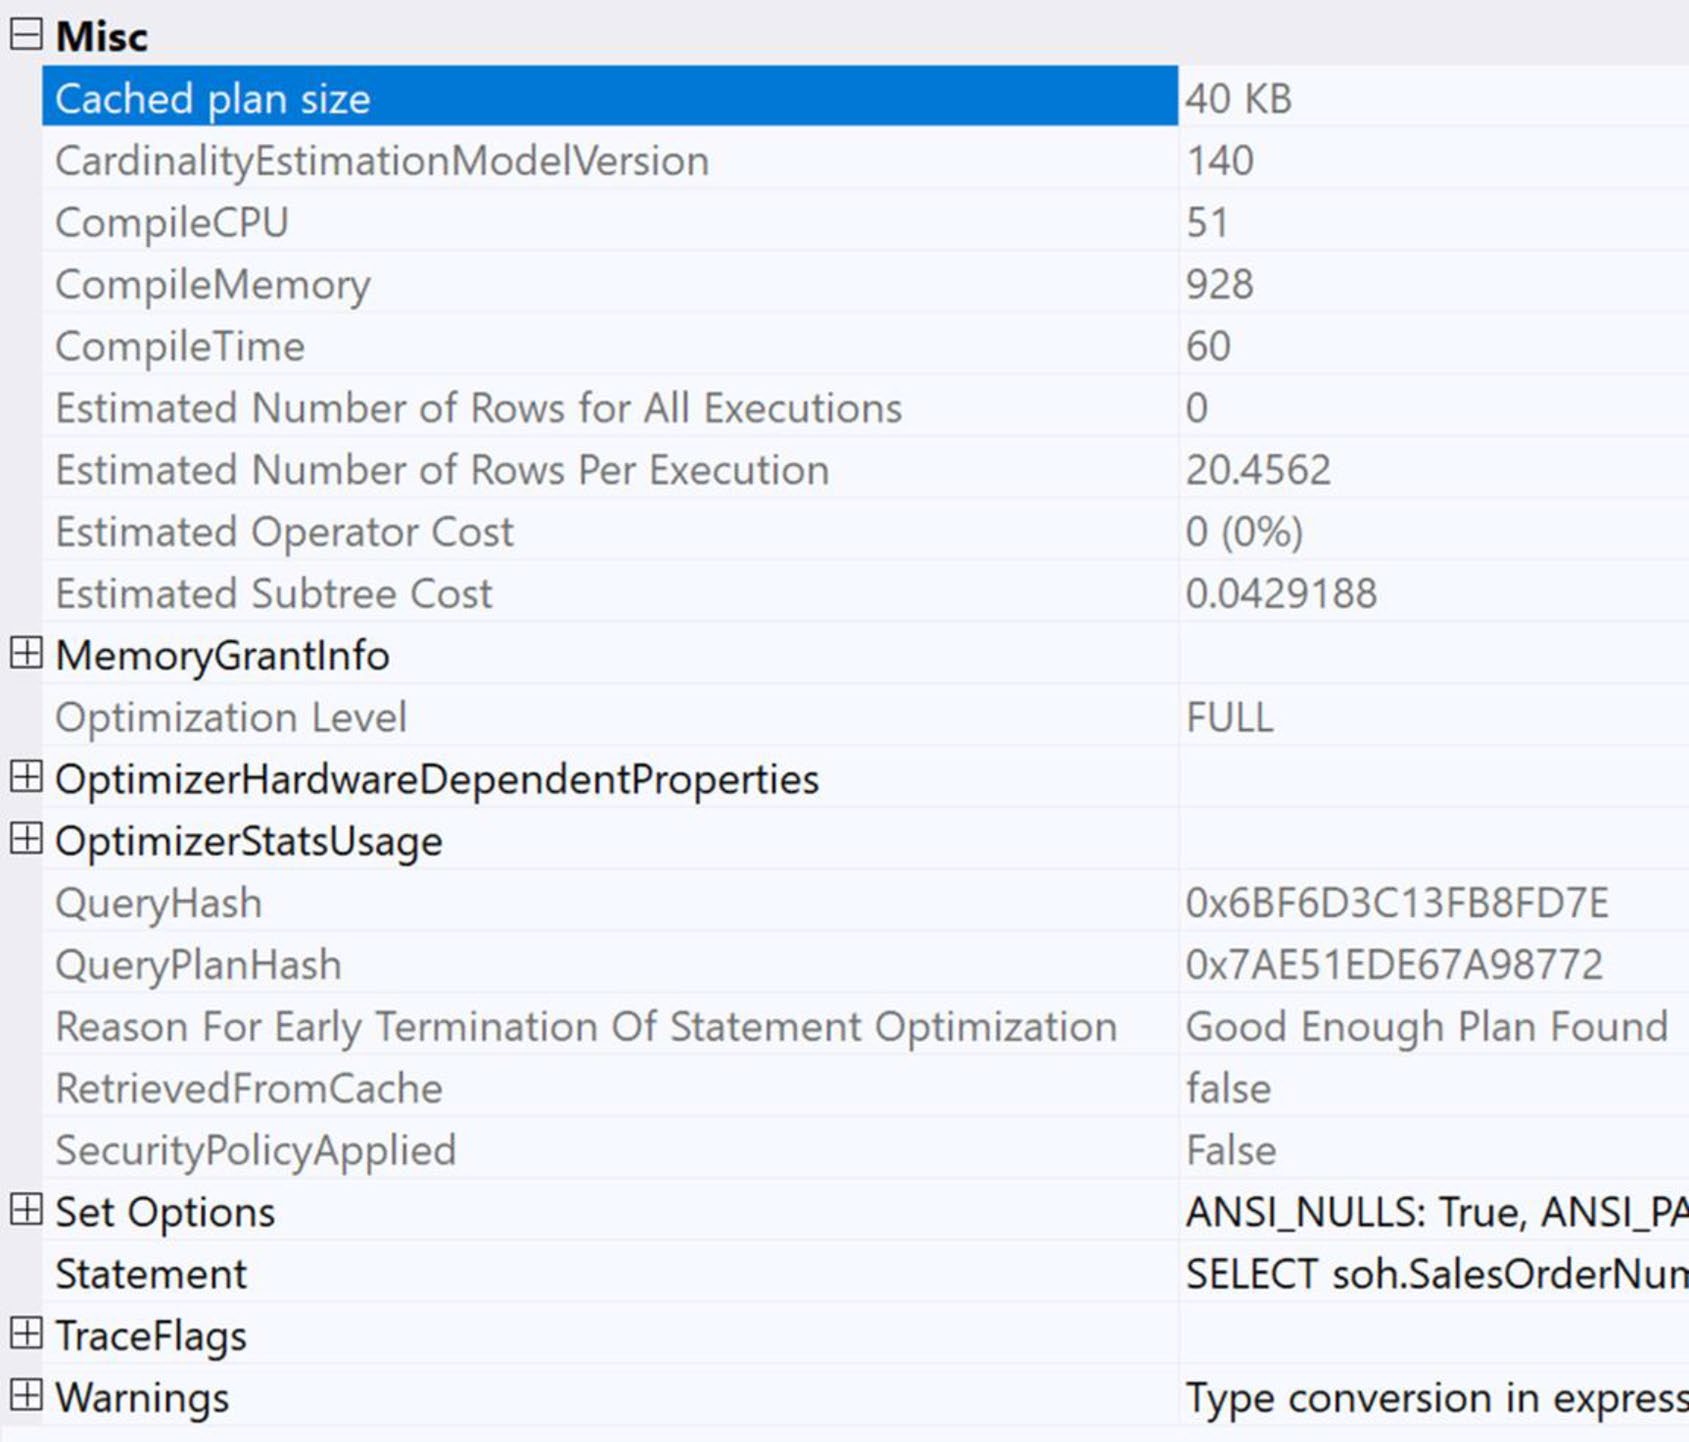
Figure 4-19: Properties of the first operator in an execution plan
警告#
警告 不一定 代表真的有問題,但代表「可能有問題」。常見類型:
- 資料型別轉換警告:例如對欄位做型別轉換可能影響 cardinality estimate
- 無 JOIN predicate:寫法不慎可能產出 Cartesian product
警告是參考訊息,不是錯誤。例如型別轉換警告若該欄位實際未用於過濾,可忽略;但「無 JOIN predicate」則通常是真實 bug。
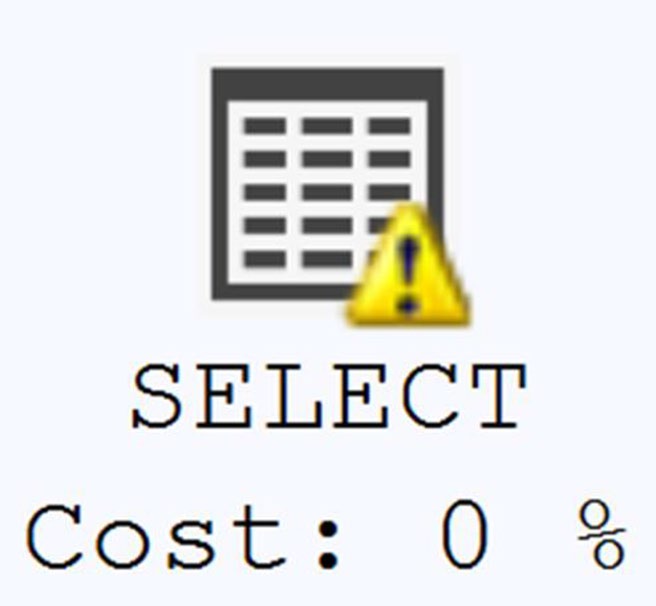
Figure 4-20: The SELECT operator with a warning indicator

Figure 4-21: Details of a warning within the properties of the operator
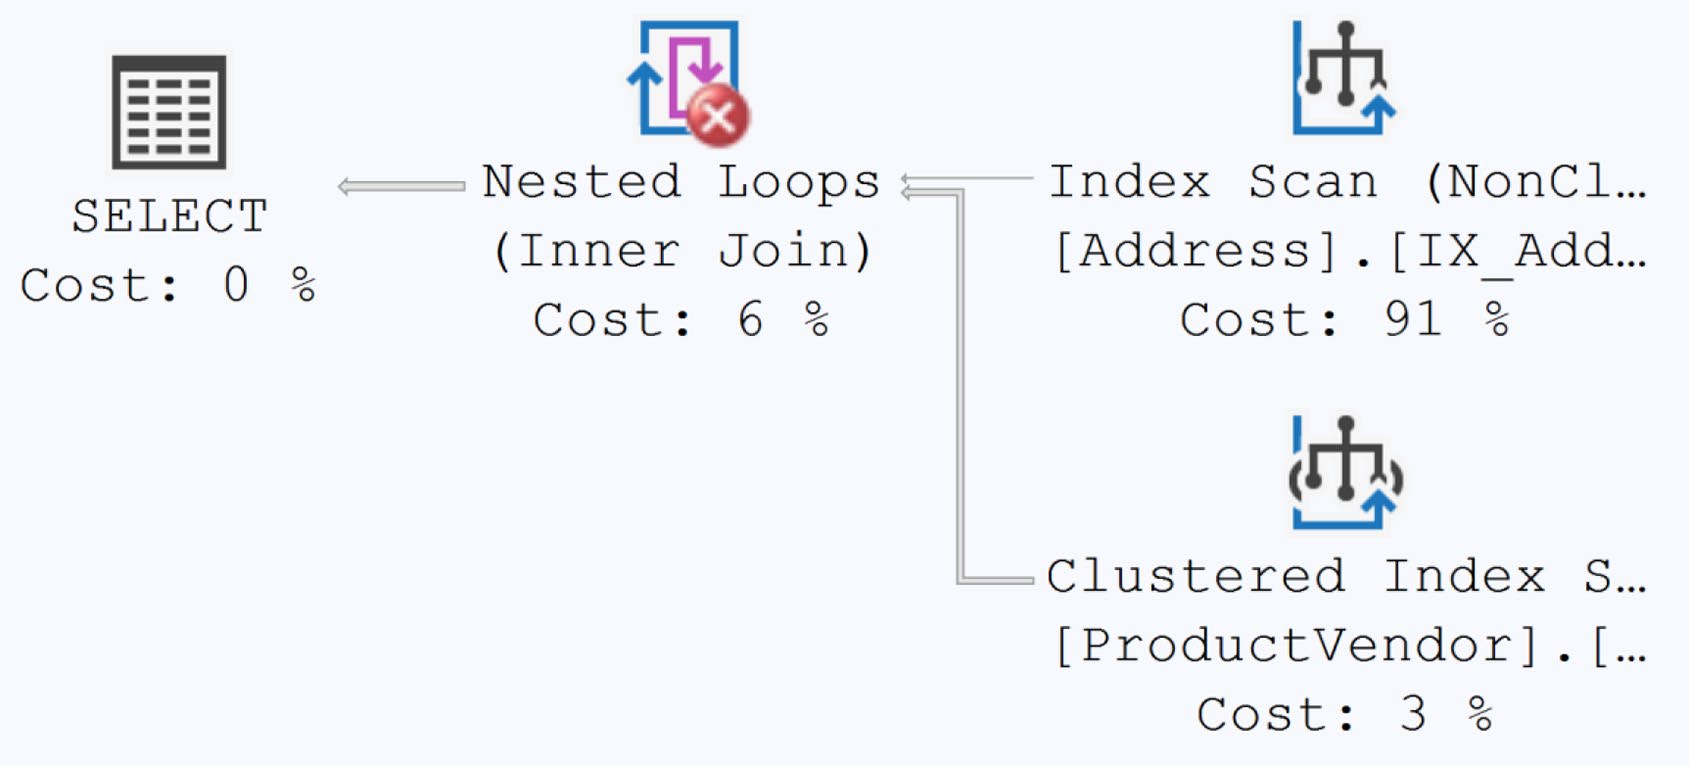
Figure 4-22: An execution plan showing another kind of warning

Figure 4-23: Warning description from the Nested Loops operator
最高成本運算子#
雖然 cost 是估算值,但它是 優化器決策的依據。觀察 Index Scan、Sort、Hash Match 等高成本 operator 通常能找到優化點。
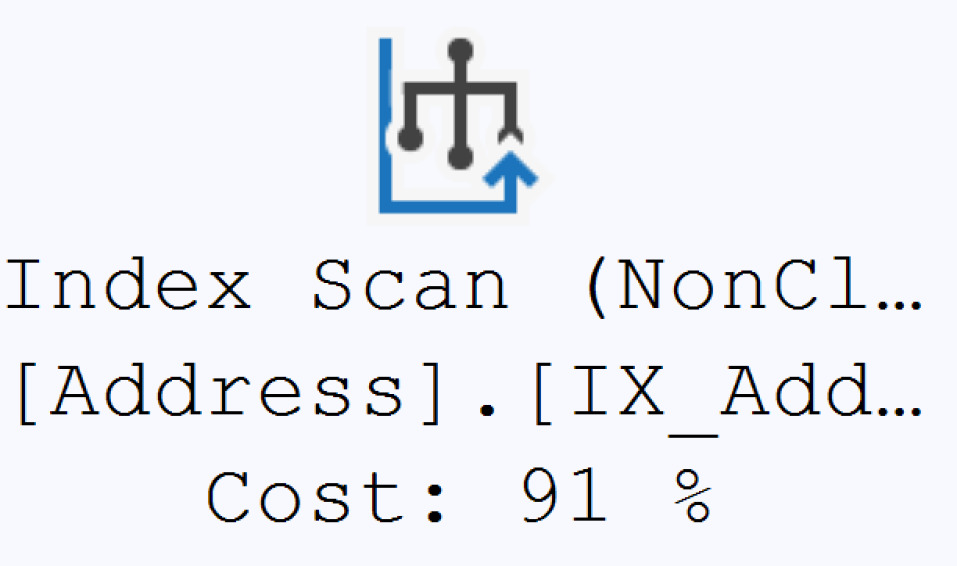
Figure 4-24: The highest cost operator in the execution plan
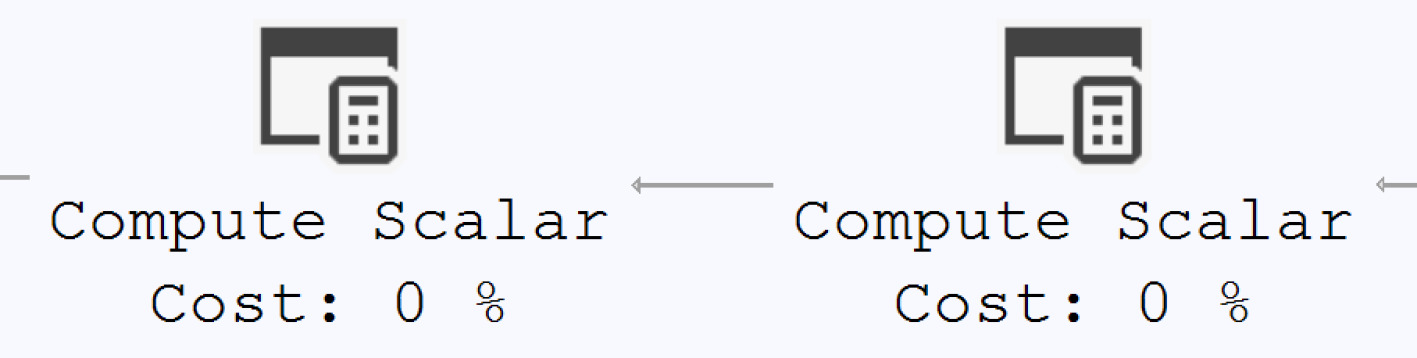
Figure 4-25: Two Compute Scalar operators represent extra operators
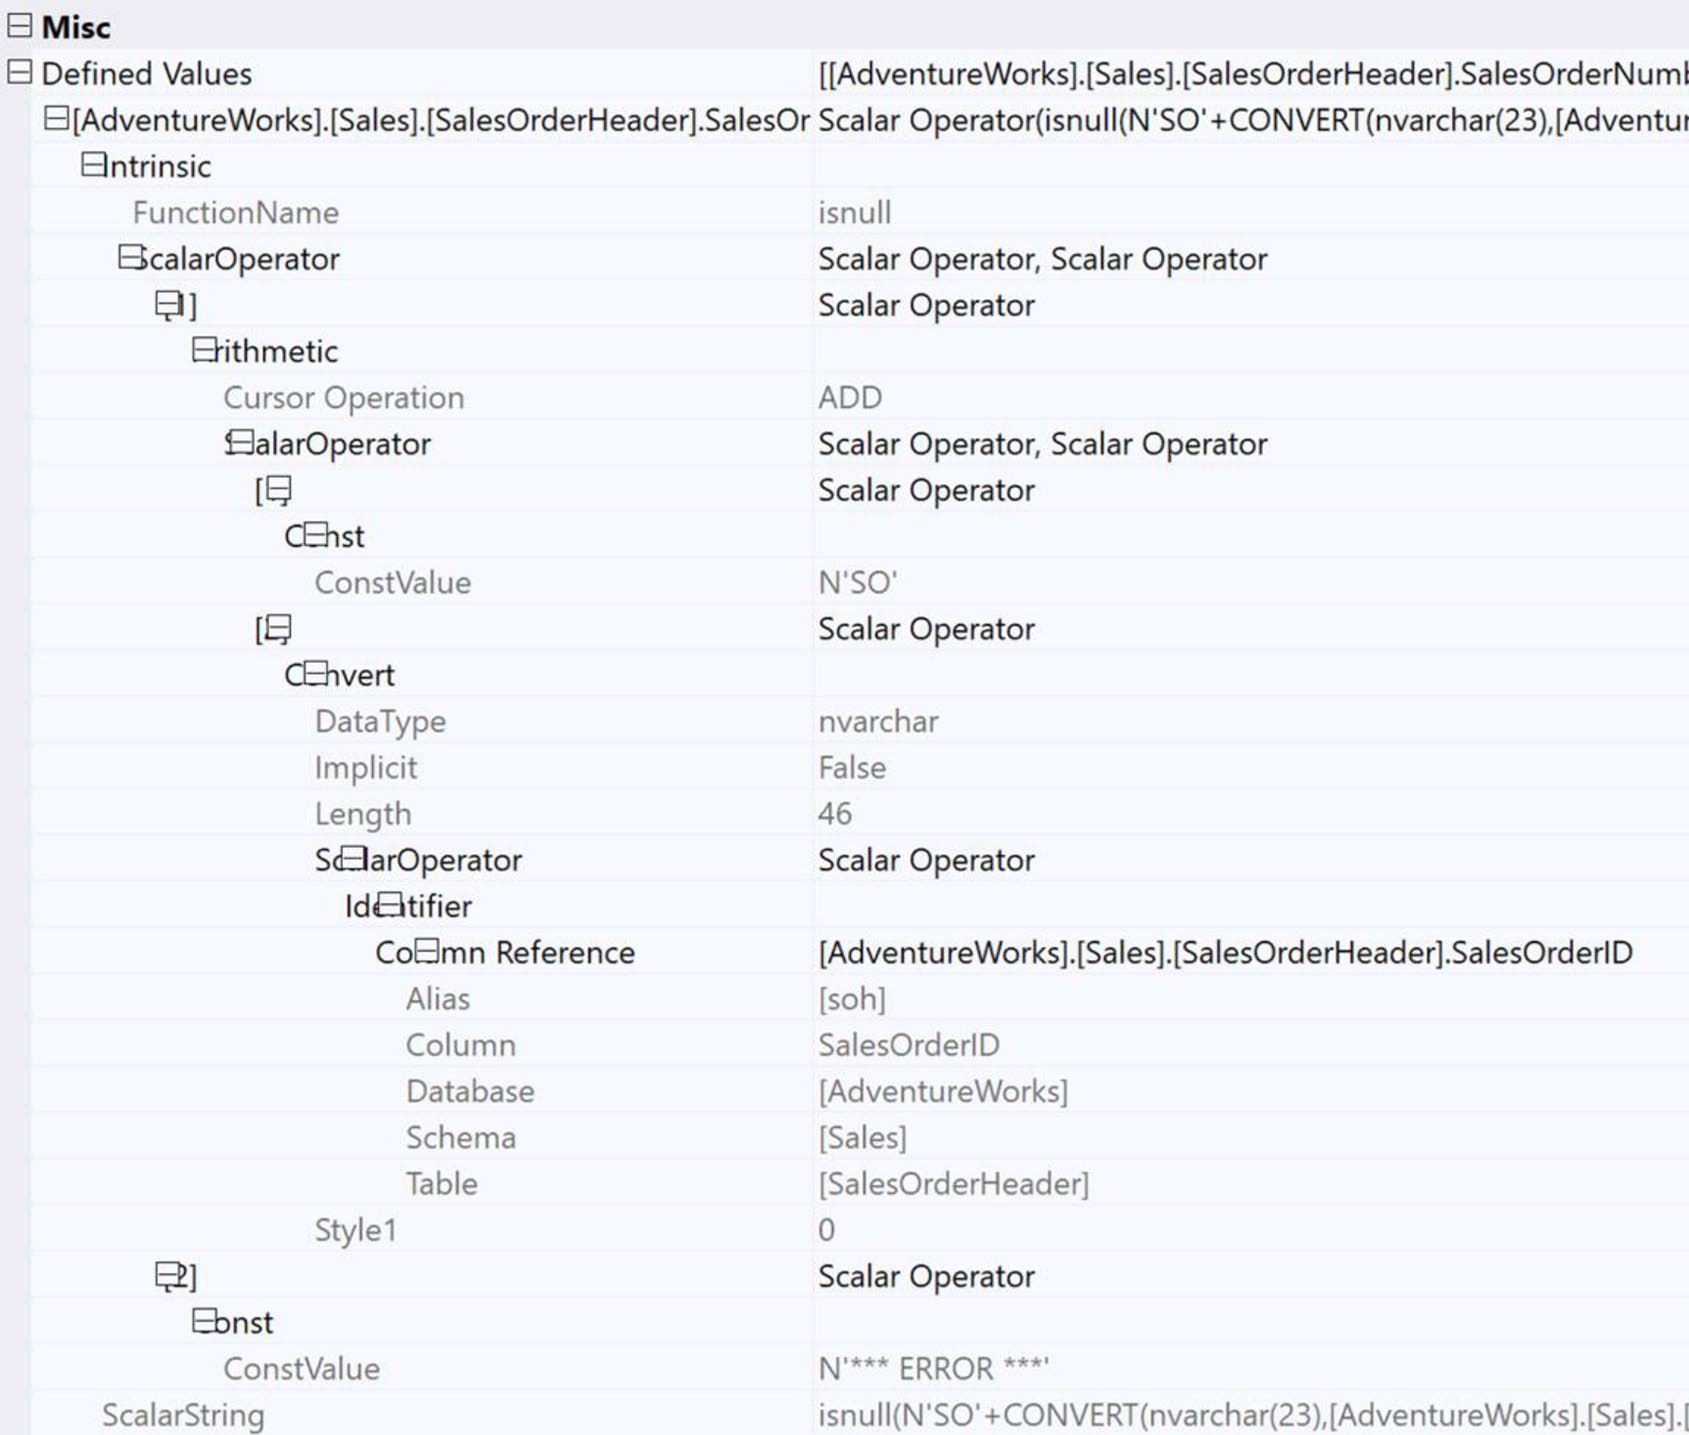
Figure 4-26: The details behind the Defined Values property of a Compute Scalar
但要小心:估算值高不代表實際慢——若 Estimated vs. Actual rows 一致,估算可信;差距大則不可全信。
Estimated vs. Actual#
兩者差距大的常見原因:
- 統計資訊過時或缺失
- 參數探嗅(parameter sniffing)造成計畫不適合本次參數
- 資料分佈劇烈傾斜
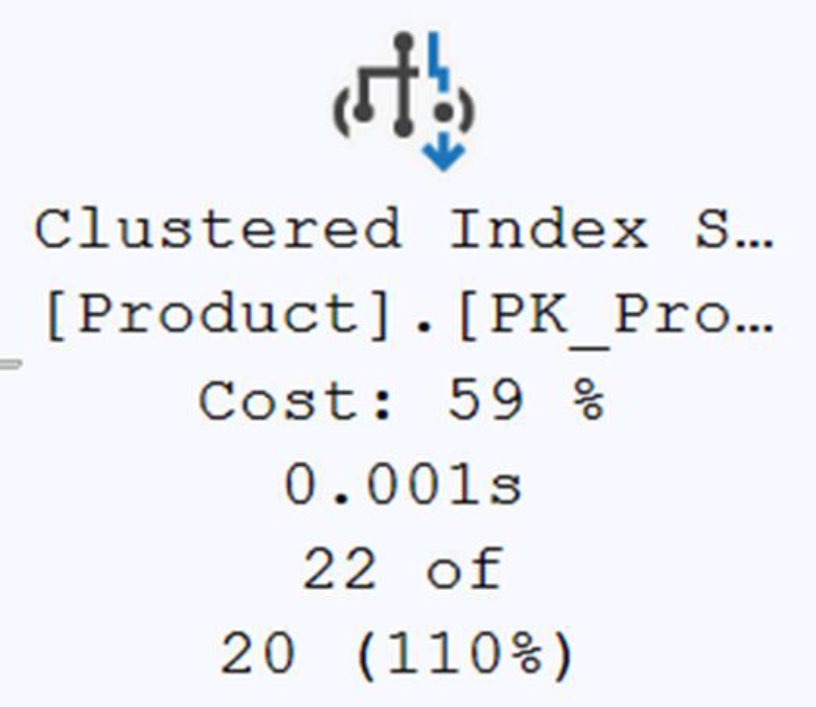
Figure 4-27: Estimated values compared with actual values in an execution plan
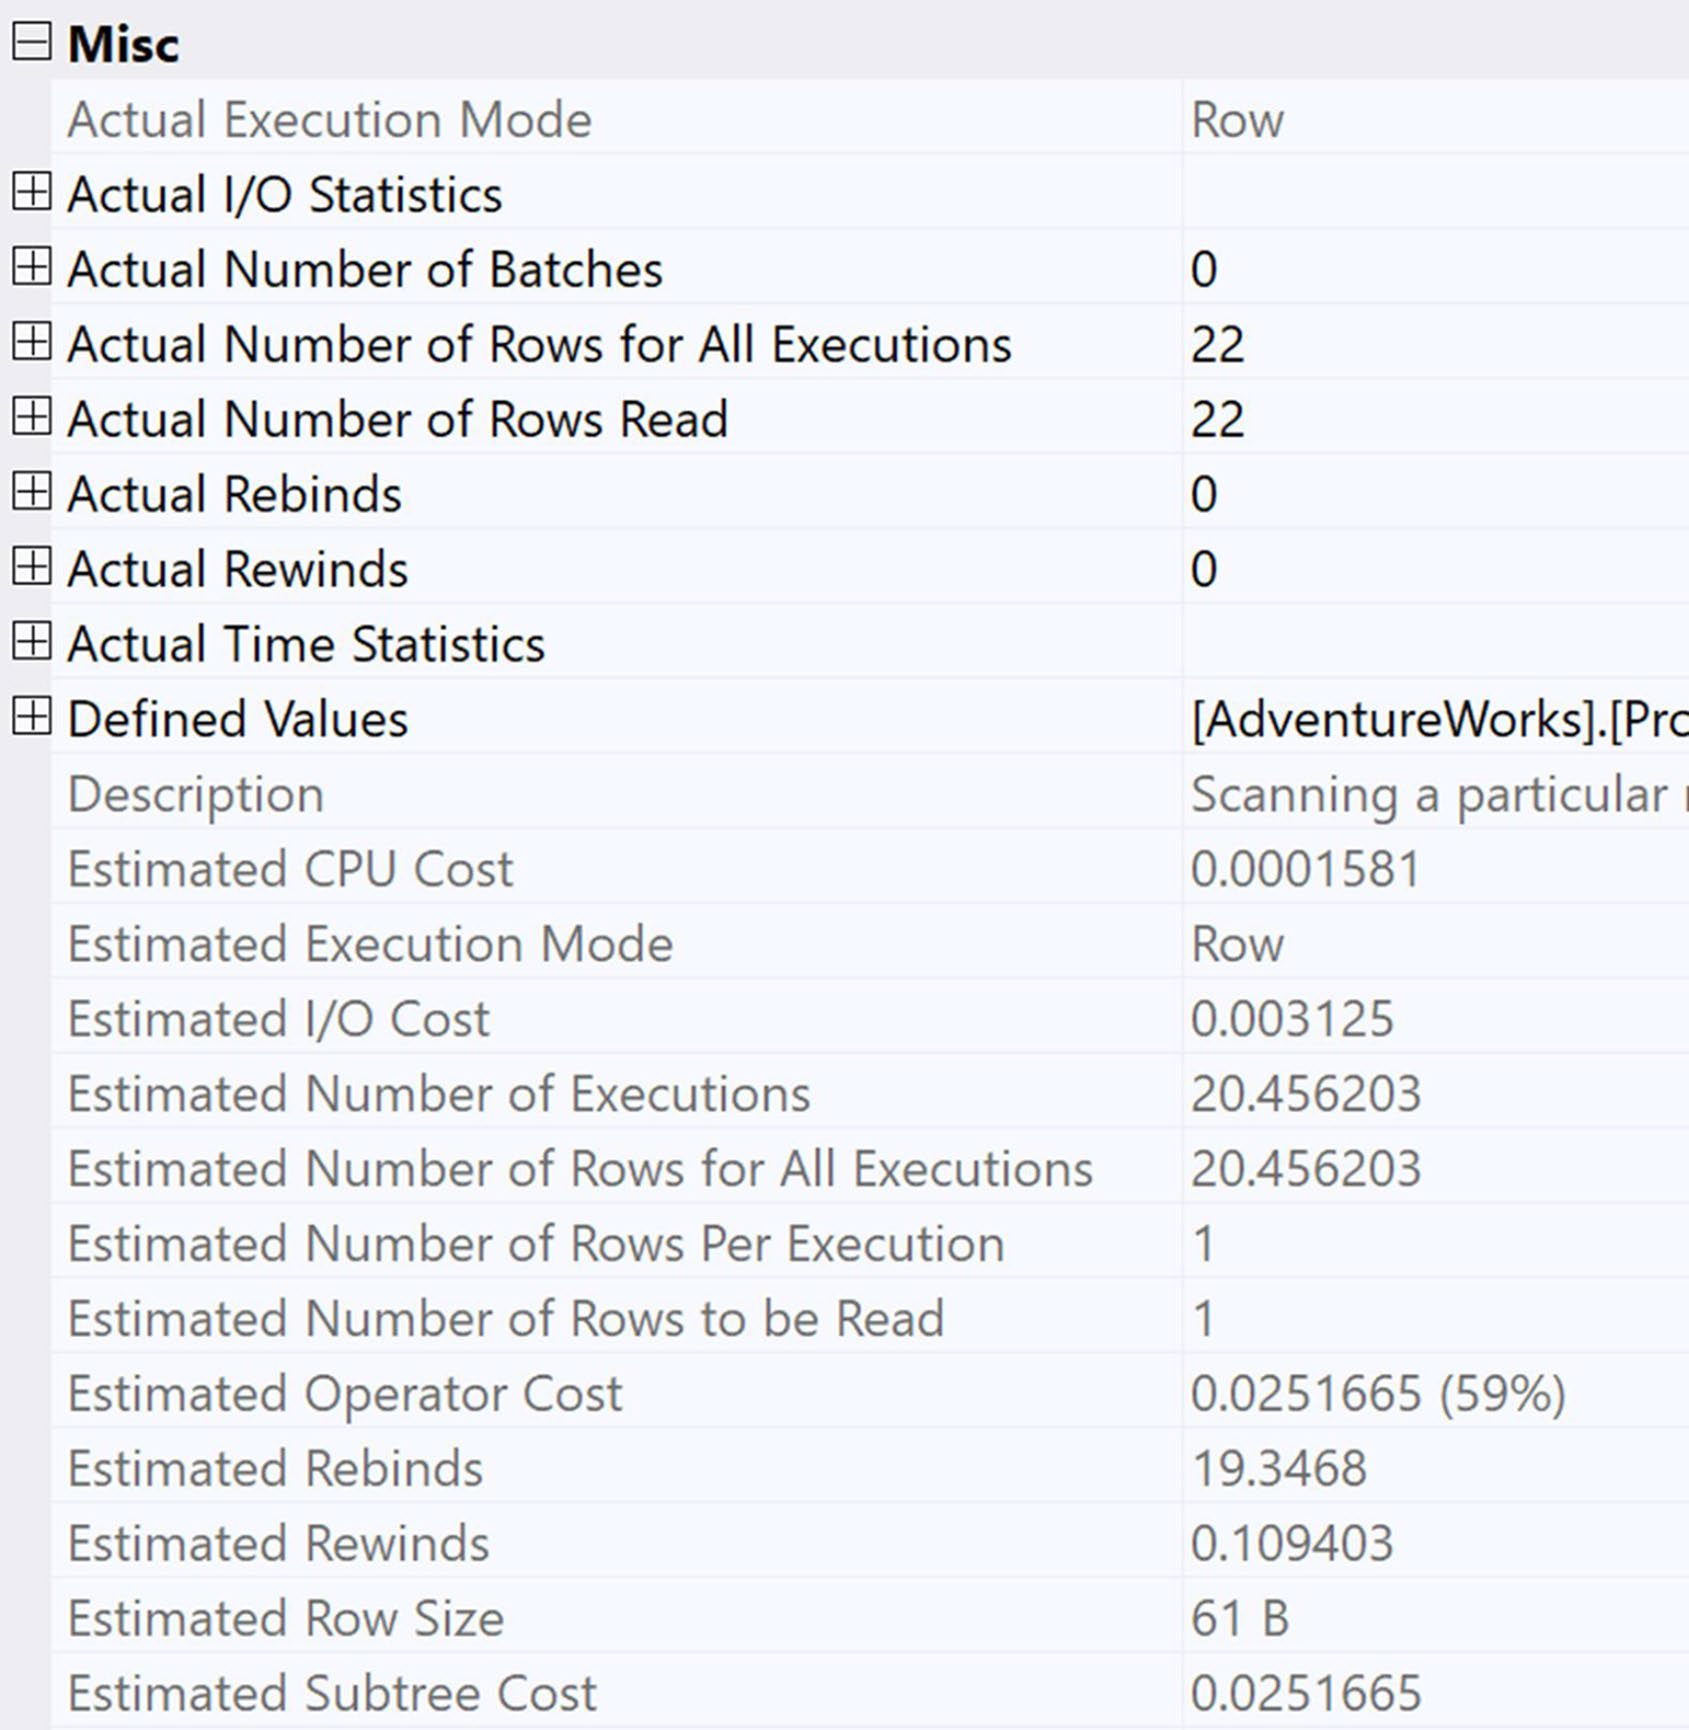
Figure 4-28: Comparing the estimated and actual values in the properties
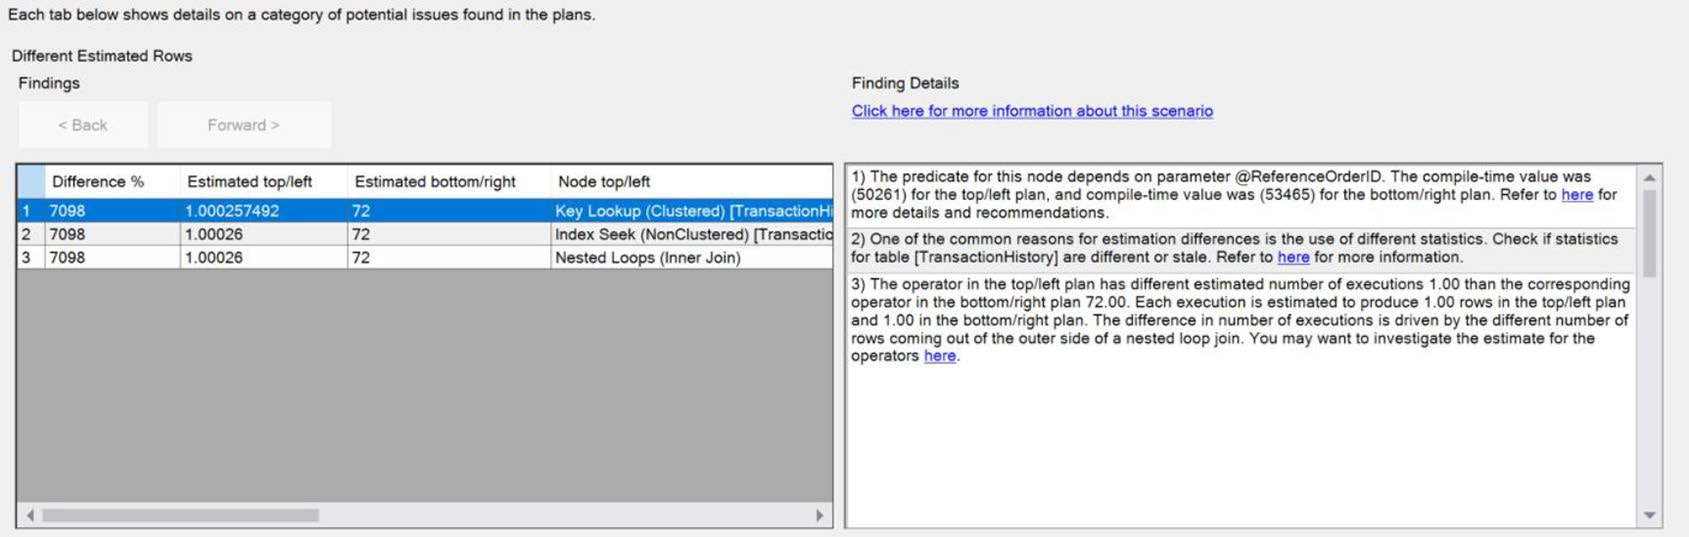
Figure 4-38: Three operators with different estimated rows
這些都是後續章節要深入處理的議題。
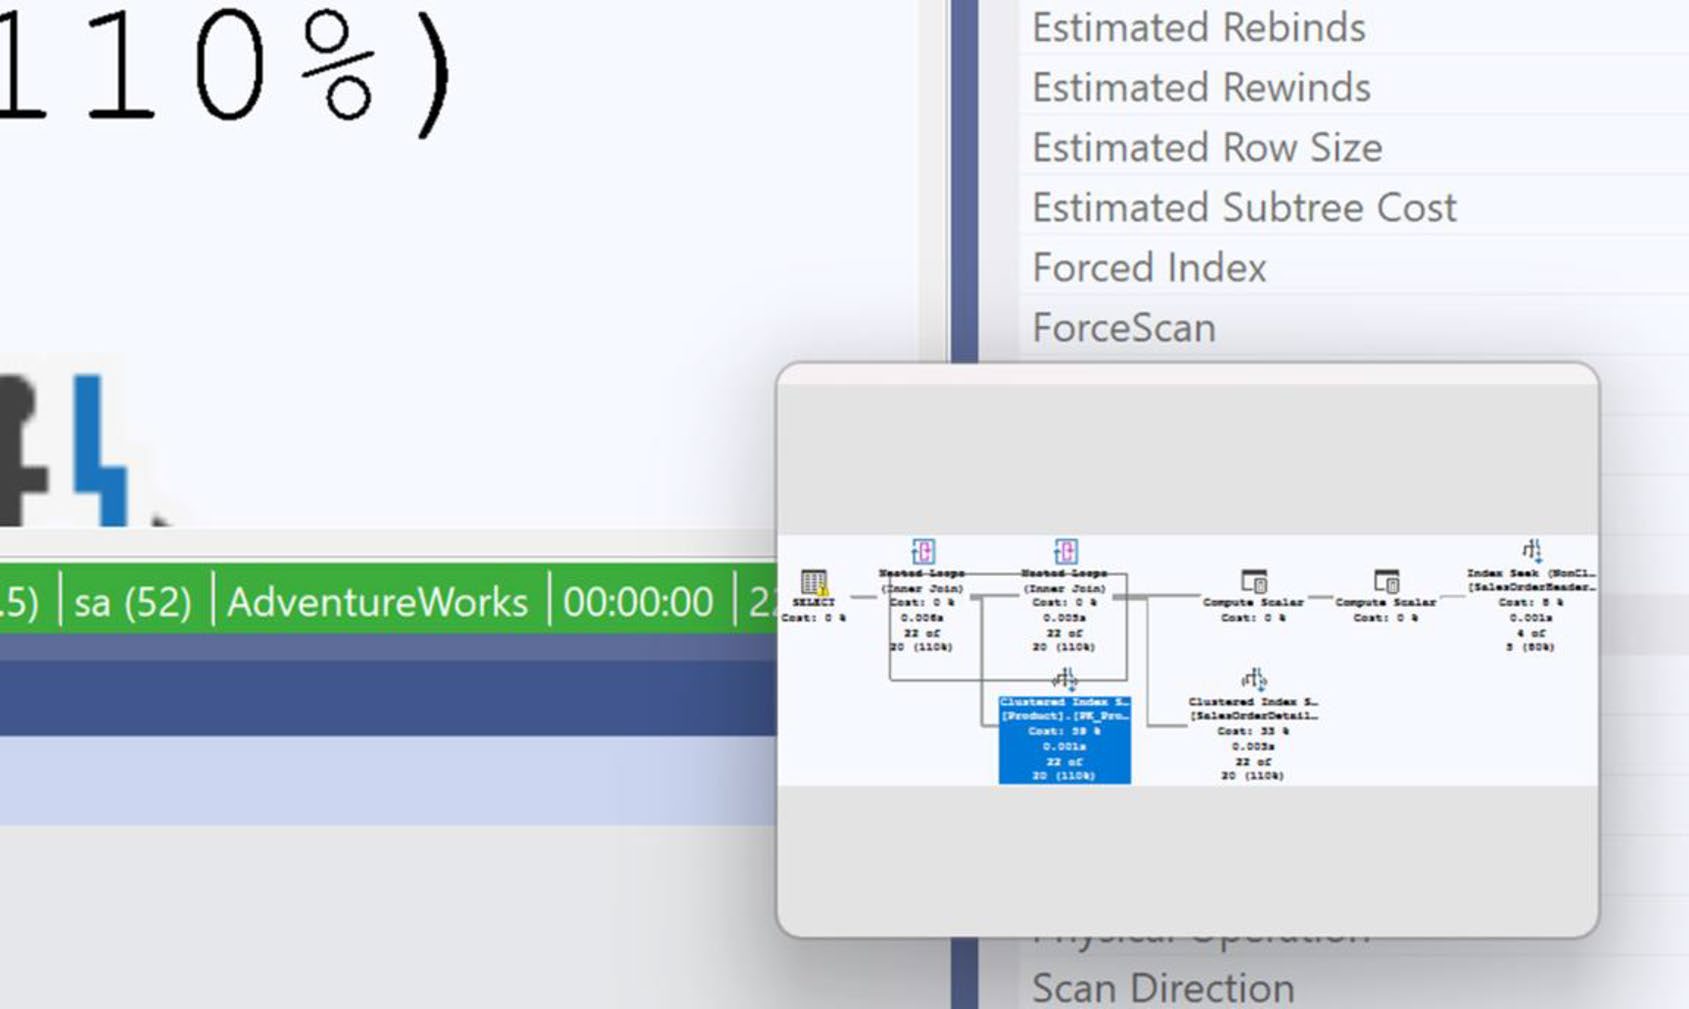
Figure 4-29: The screen for dragging around the view of an execution plan

Figure 4-30: The Find Node window open within an execution plan
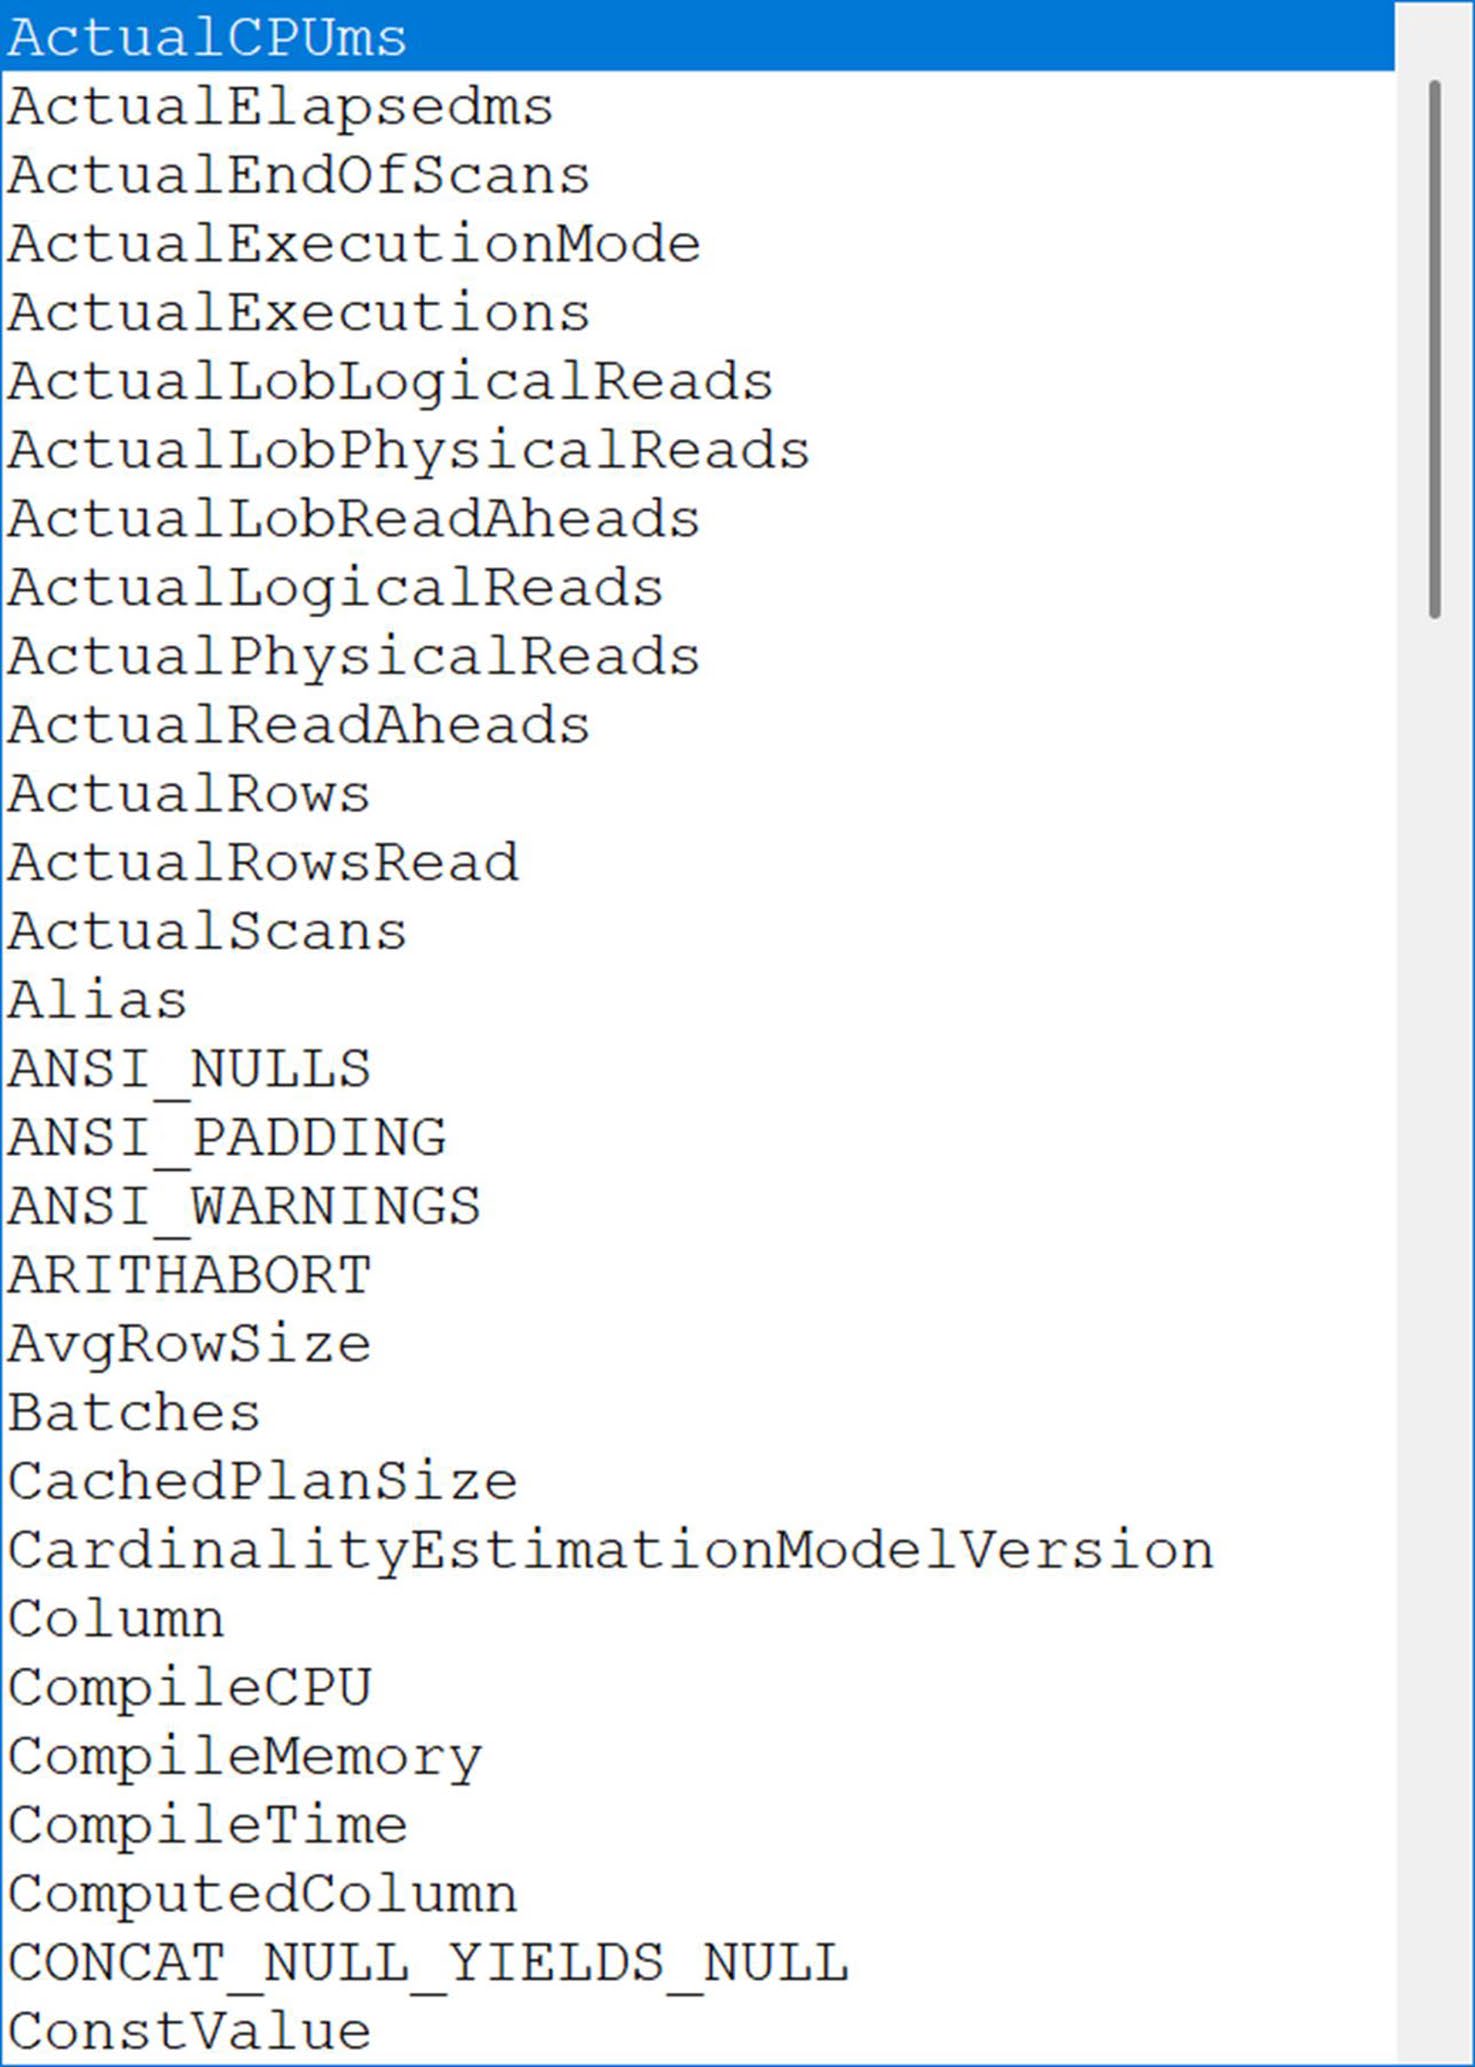
Figure 4-31: Part of the list of properties in the Find Node drop-down menu
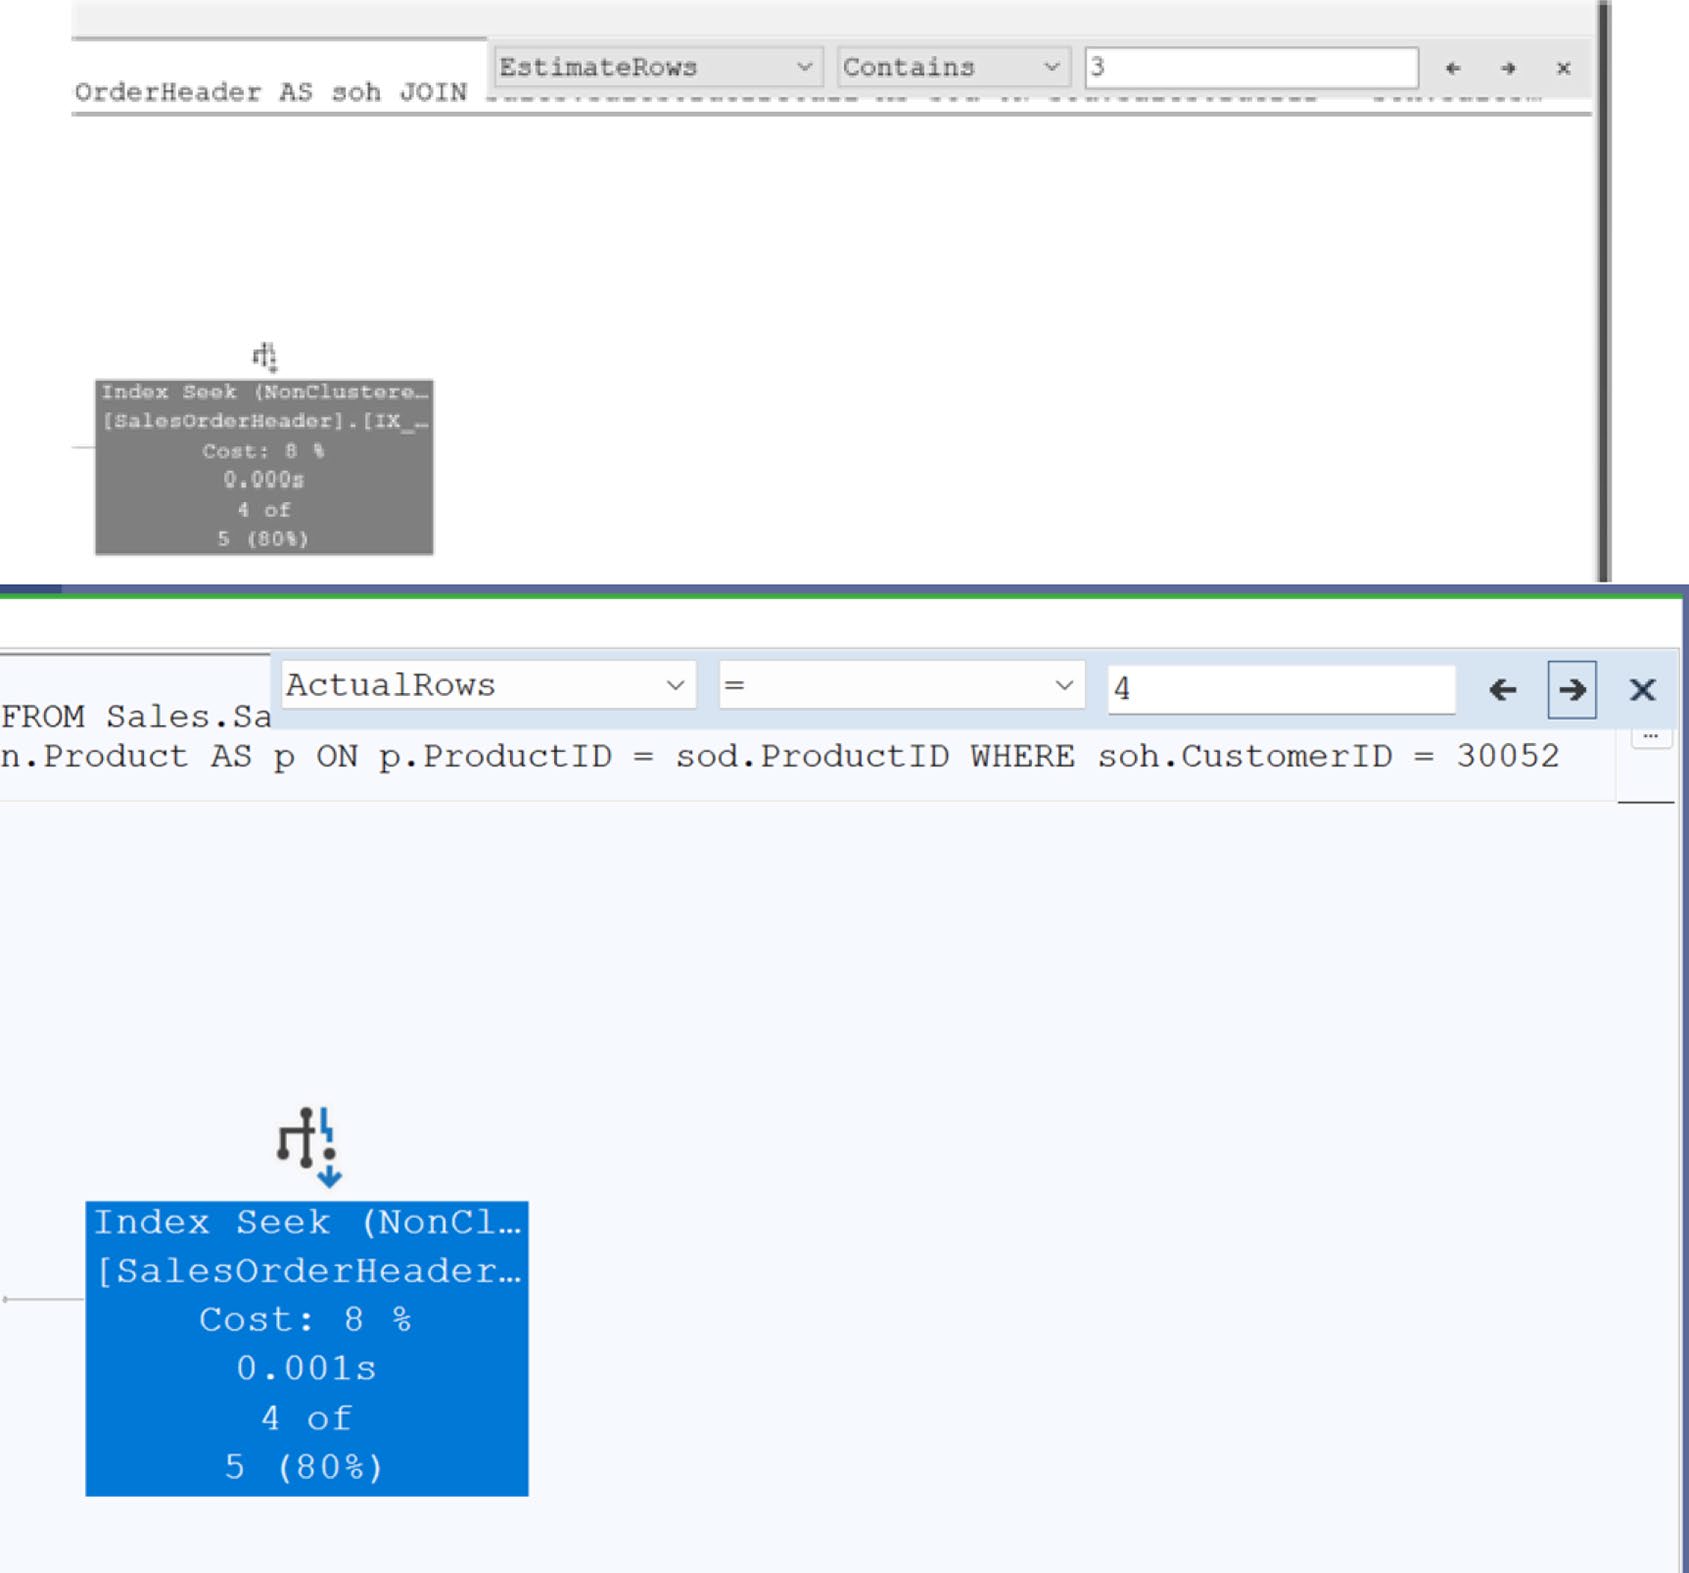
Figure 4-32: Results of searching for operators using Find Node
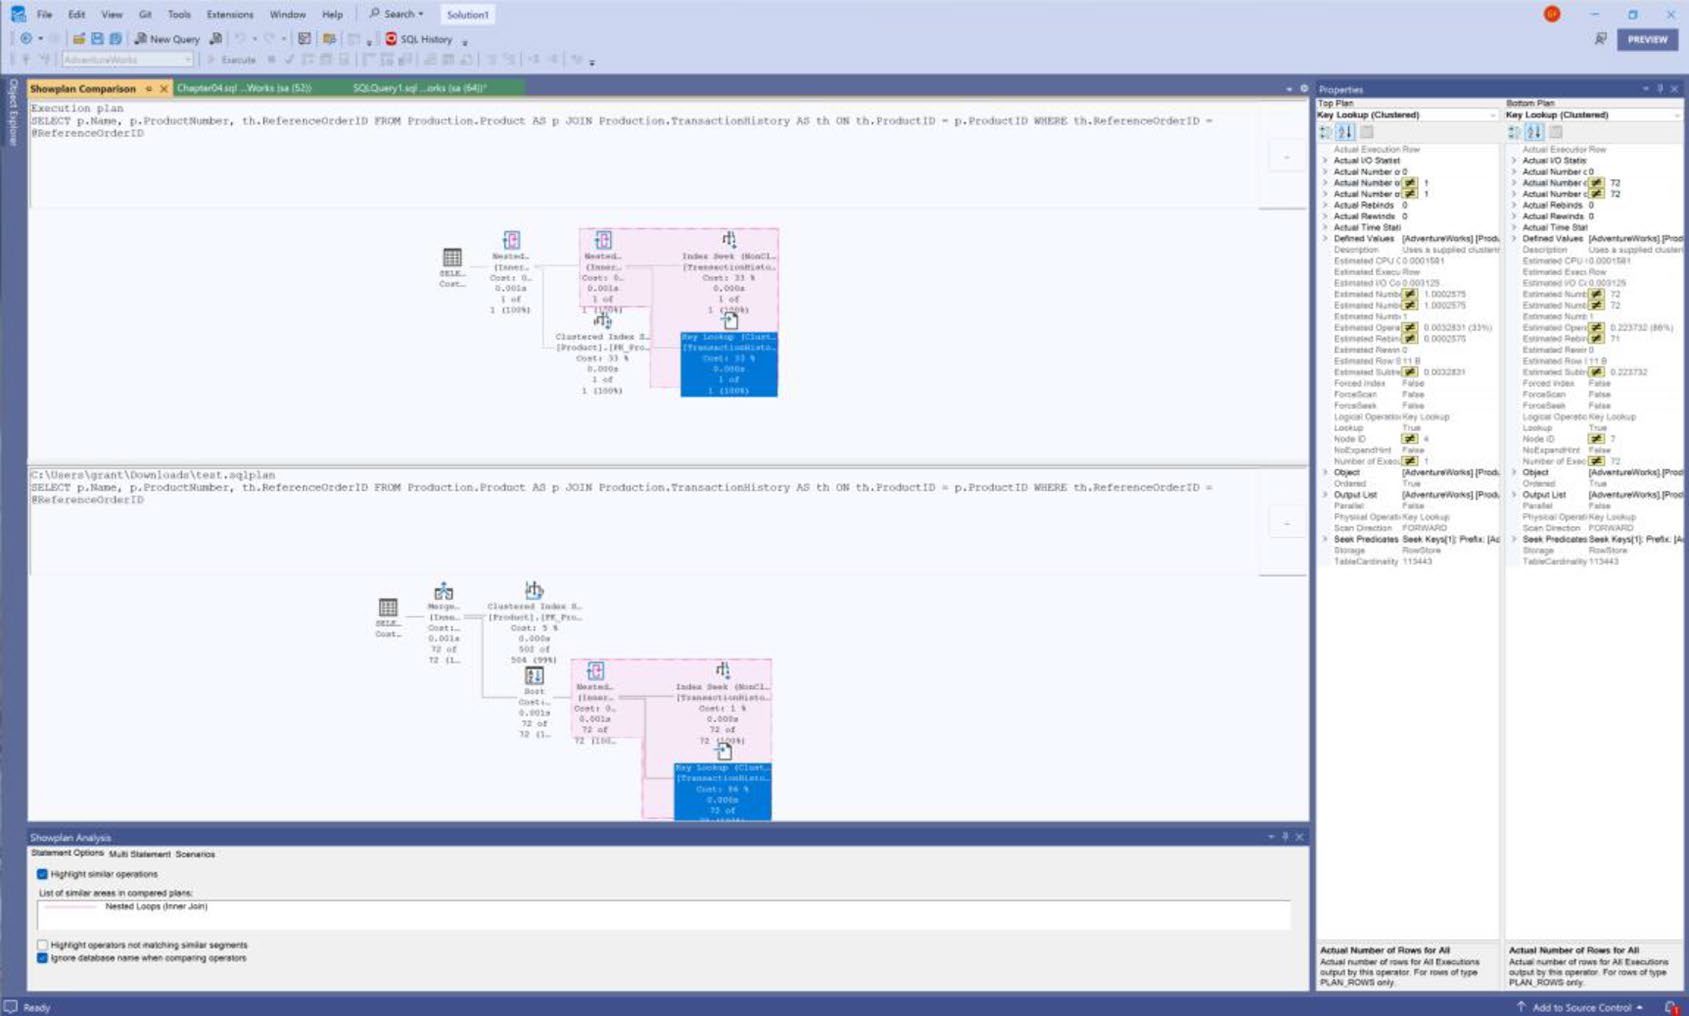
Figure 4-33: Comparing two execution plans within SSMS
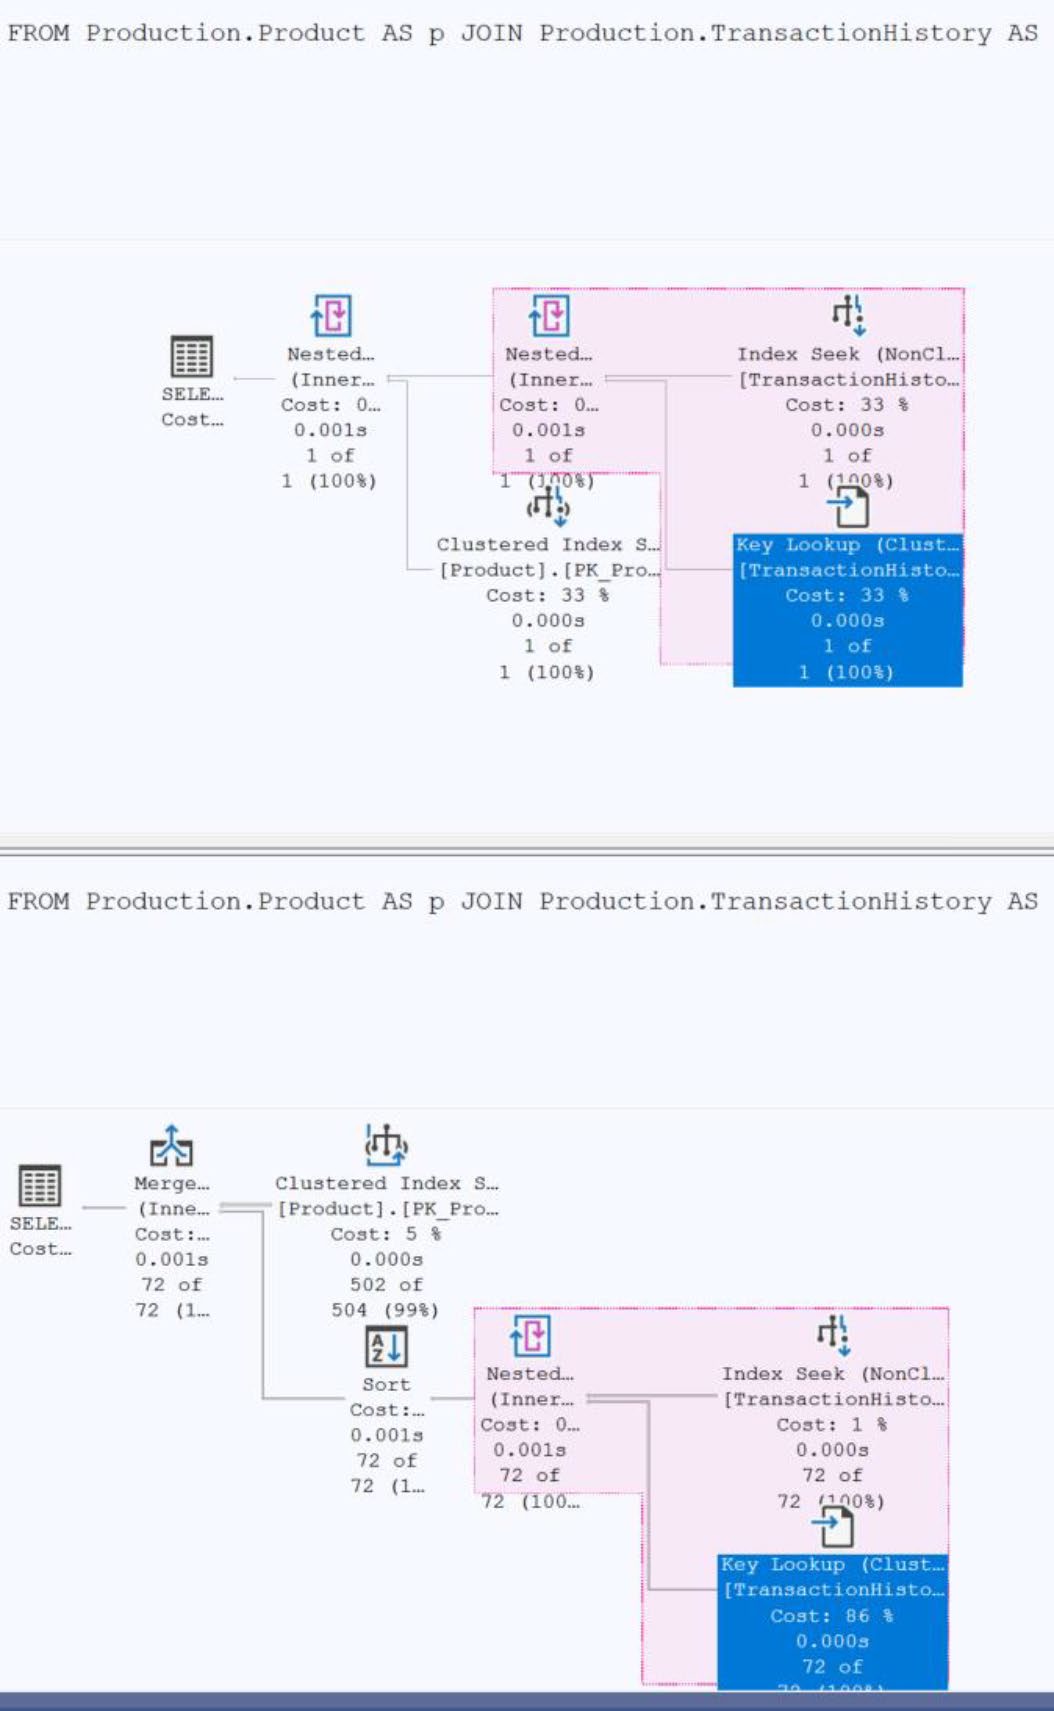
Figure 4-34: Compared plans showing common characteristics
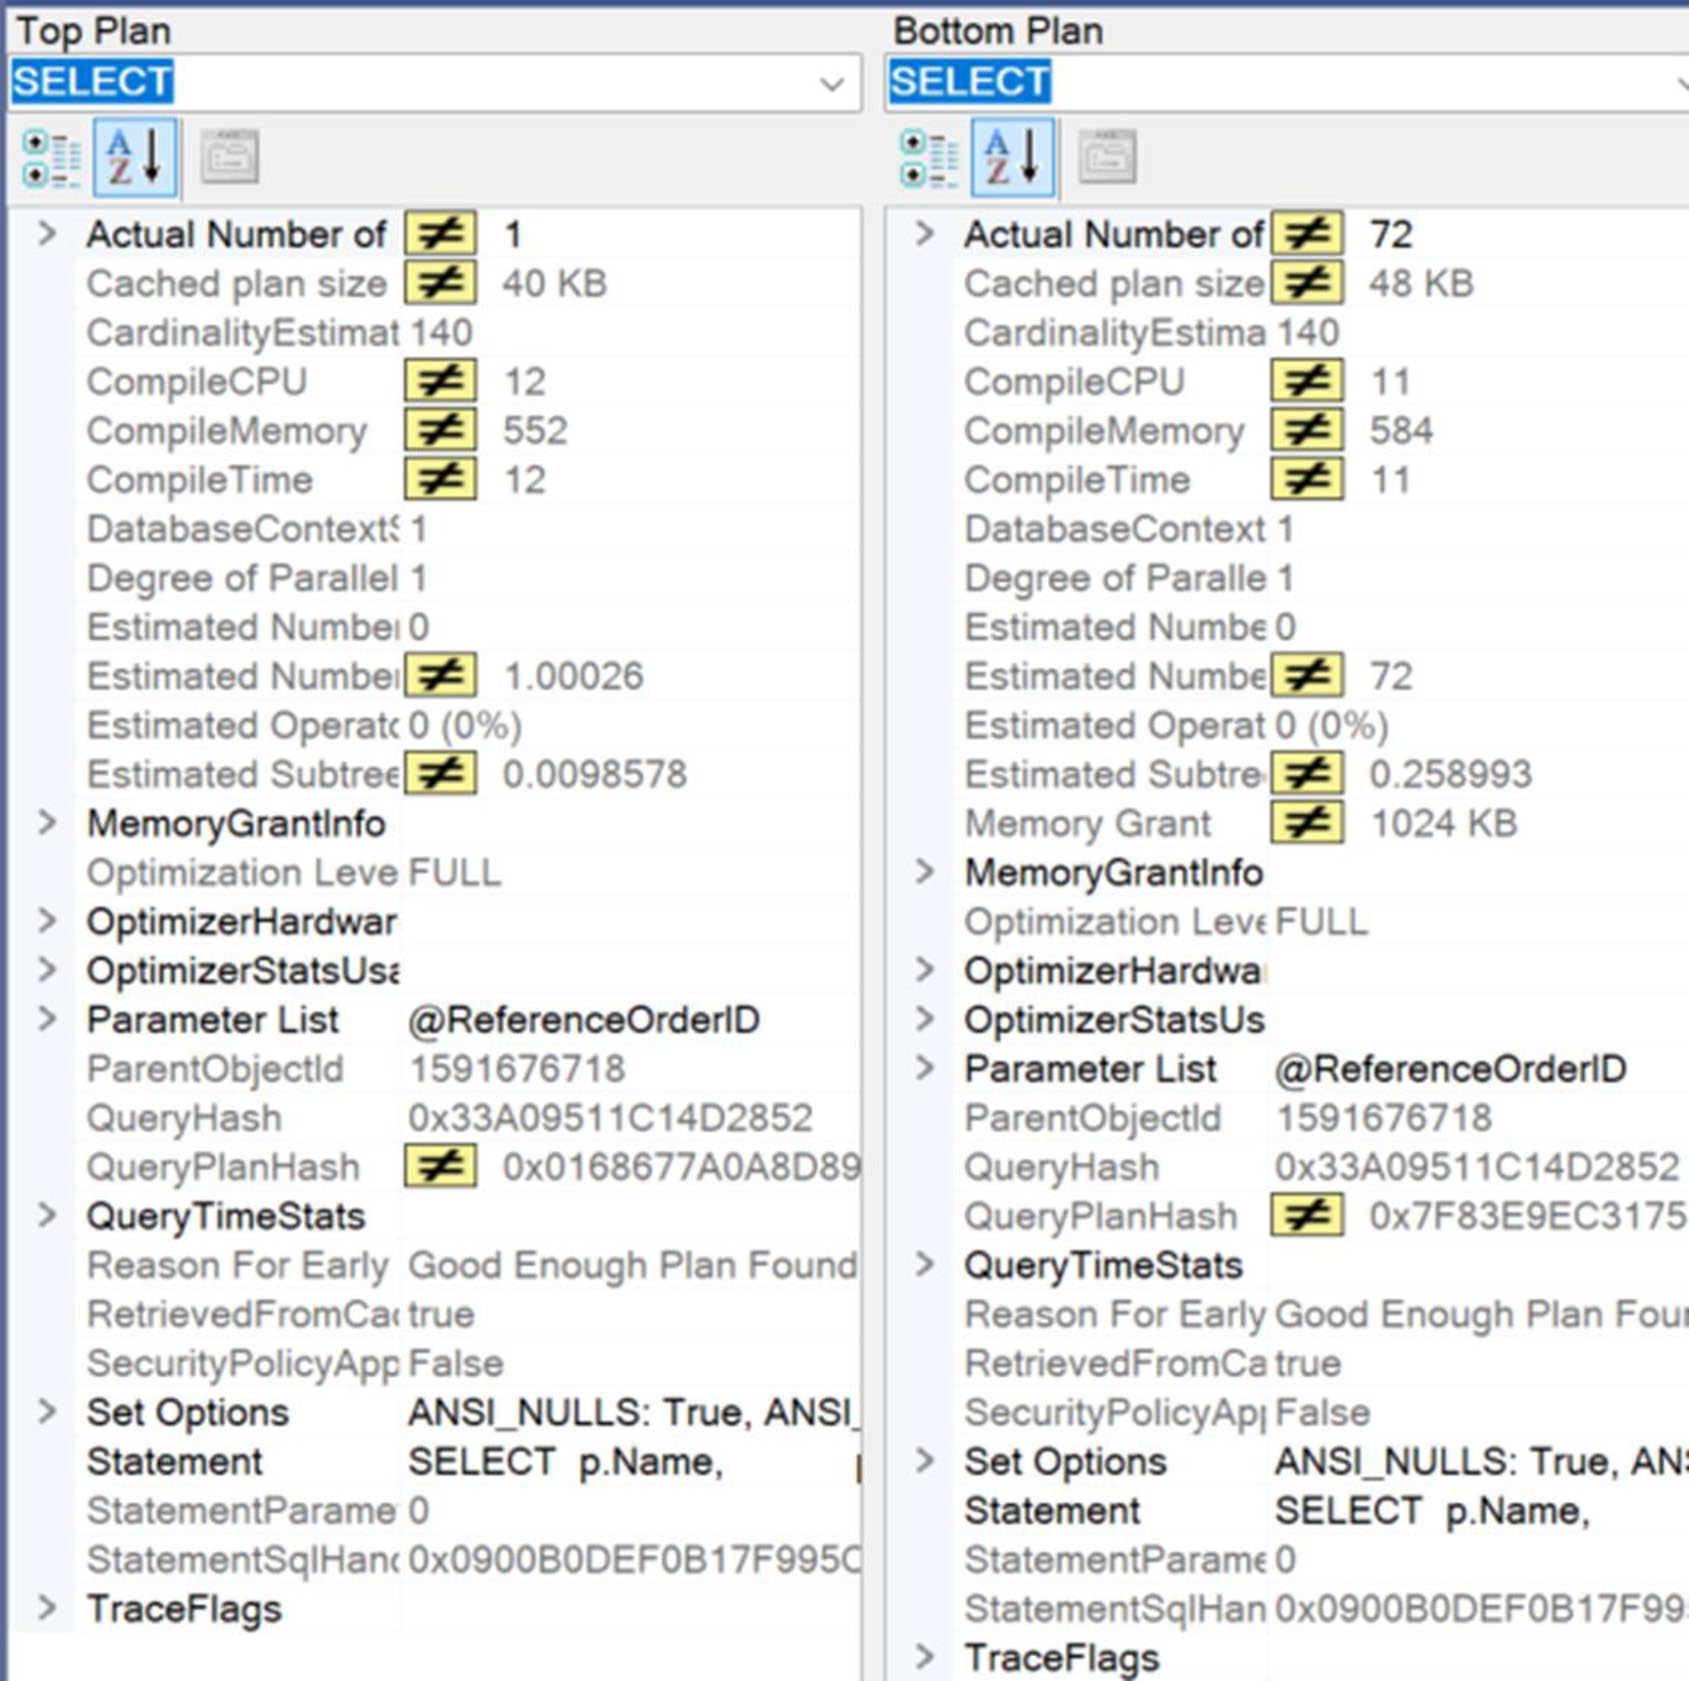
Figure 4-35: Comparing the values of properties between two plans
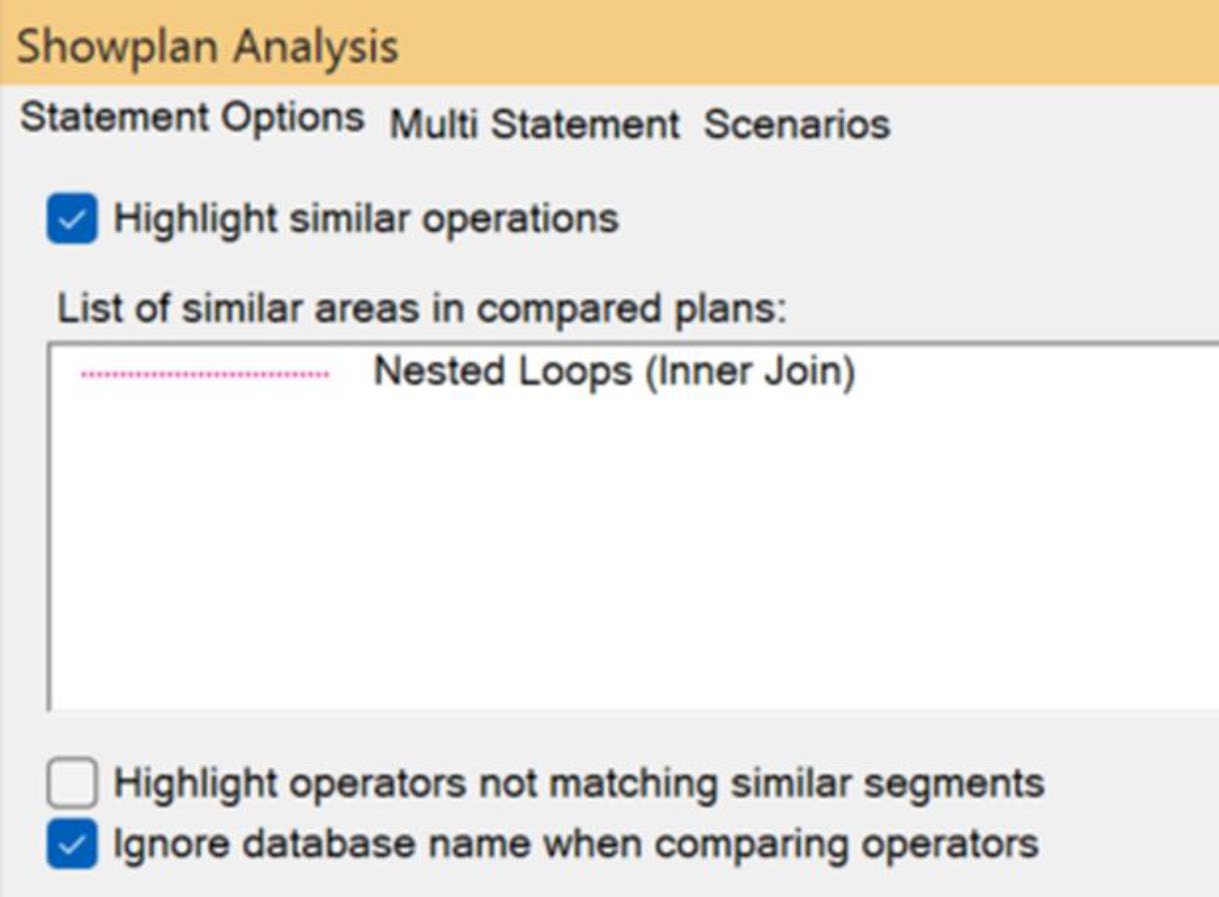
Figure 4-36: Options for comparing execution plans

Figure 4-37: Multi-statement selection in a plan comparison
Figure 4-39: Include Live Query Statistics
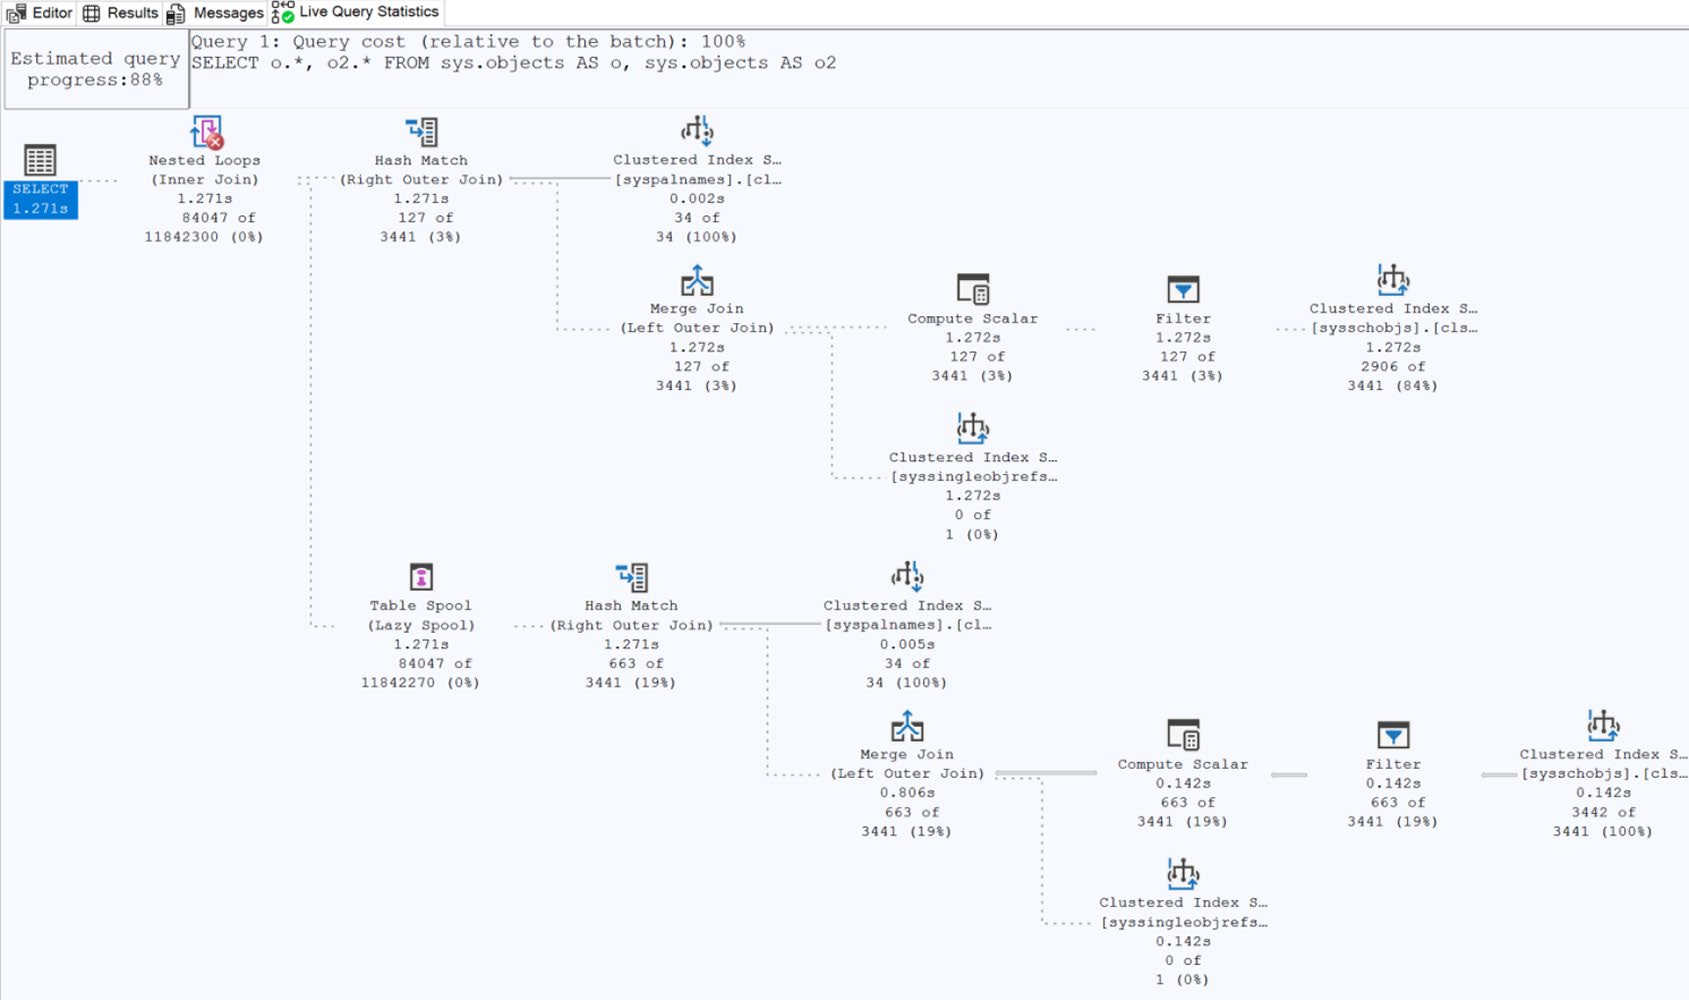
Figure 4-40: A live execution plan in action
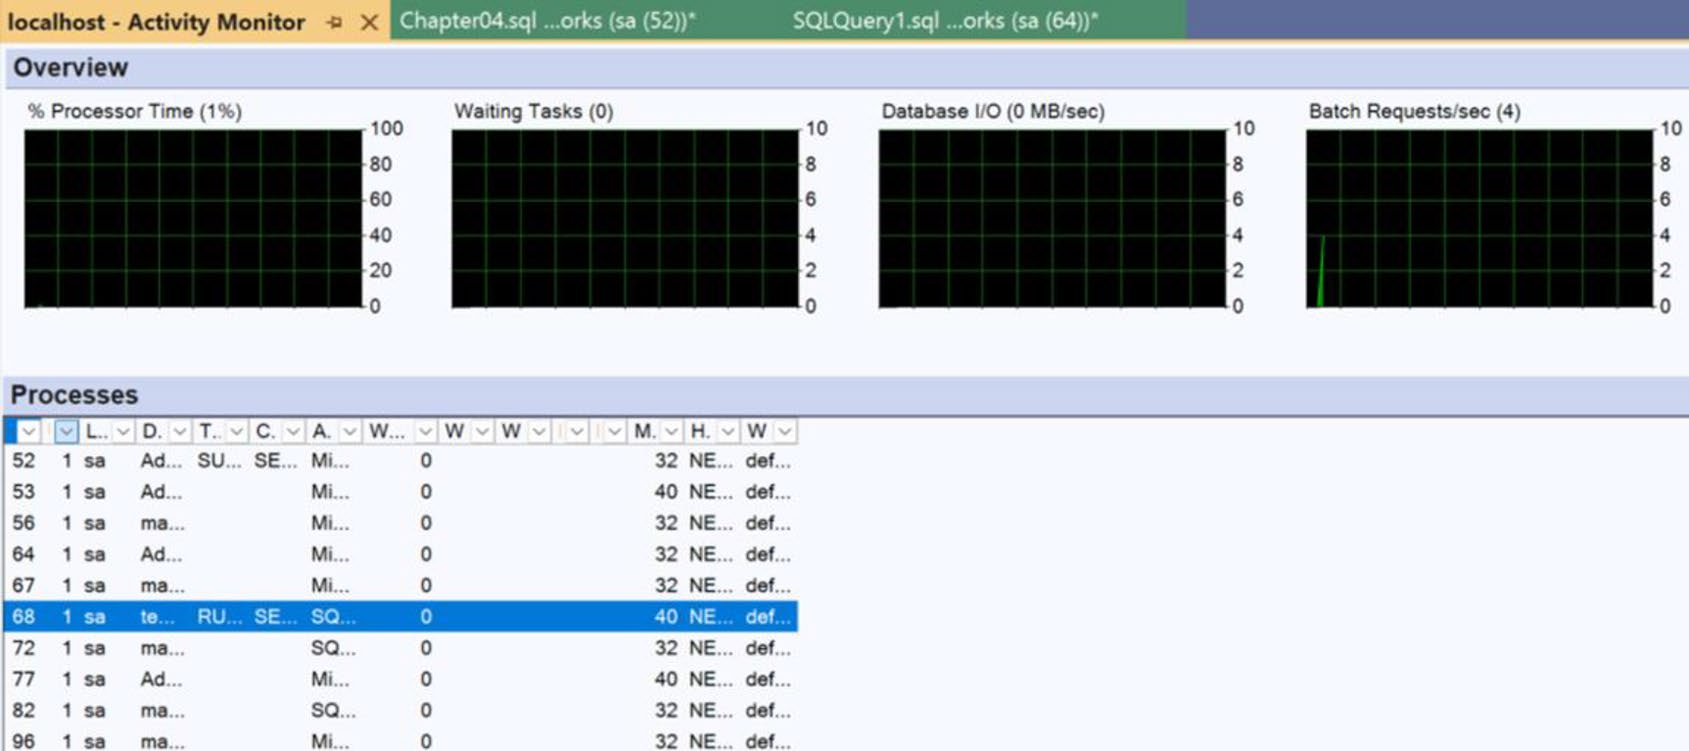
Figure 4-41: The Activity Monitor window in SSMS
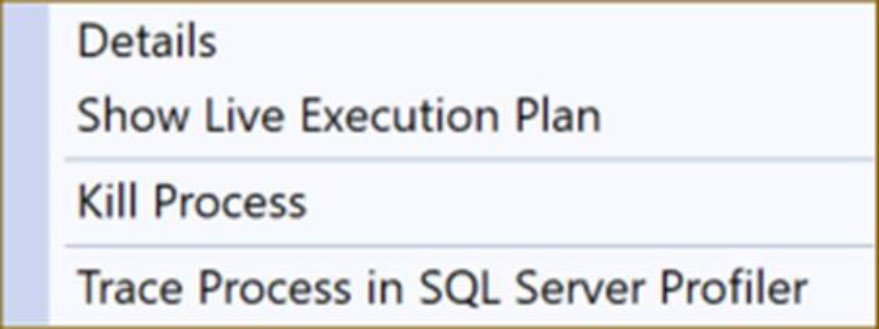
Figure 4-42: Context menu that lets you select Show Live Execution Plan
本章定調#
- 計畫只有一種——「Actual」只是多了 runtime metrics
- 抓計畫就別測效能,反之亦然
- 四種來源各有適用情境:SSMS 快、DMV 即查、Query Store 歷史、XE 細節
- 讀計畫從七大路標切入,不要逐一硬讀屬性
接下來第 5 章將深入 統計資訊(statistics)——所有「Estimated rows」的根源。