為什麼量測這麼重要#
調校的循環是「量測 → 改 → 再量測」。沒有可信的量測,任何改動都只是猜測。Fritchey 在這一章把所有取得查詢指標的方法整理過一次,最後選了三個他長期實戰中最可靠的工具來深入講:
- Dynamic Management Views(DMV)
- Query Store
- Extended Events
不論用哪一種,保持一致性 才能比較。每個工具給出的數字都不一樣,混用會誤判。
量測方法總覽與作者的取捨#
| 方法 | 作者使用度 | 主要問題 |
|---|---|---|
| Include Client Statistics | 不用 | 含 client 與網路時間,不準確 |
| Connection Properties | 偶爾備援 | 沒有 I/O |
SET STATISTICS TIME / IO | 視情況 | 單次量測難取平均;同時開 IO 會干擾 TIME 精度 |
| QueryTimeStats(執行計畫) | 視情況 | 只有單次;抓計畫本身會拖慢查詢 |
| Trace Events / Profiler | 不建議 | 開銷大、無法在擷取時過濾、Profiler GUI 吃資源 |
| Query Store | 推薦 | 第 6 章專章 |
| DMV | 推薦 | 隨手可用 |
| Extended Events | 推薦 | 第三章重點 |

Figure 3-1: Connection properties showing elapsed time
SQL Server 2012 以後 避免使用 Trace Events / Profiler。它與引擎是分離實作,開銷比 Extended Events 大很多;Profiler GUI 連線到 production server 還會在伺服器上開額外記憶體空間。
想看一個查詢「跨多個相關物件的細粒度 I/O」時,
SET STATISTICS IO ON仍然是最快的方式。
Dynamic Management Views(DMV)#
DMV 隨 SQL Server 從 2005 起就一直存在,自建環境、AWS RDS、Google Cloud SQL、Azure SQL Database 全部支援。即使 Query Store 沒開、Extended Events 沒跑,DMV 永遠隨手可查。
文件曾區分 Dynamic Management Views 與 Dynamic Management Functions,但實務上大家統稱 DMV。本書沿用此習慣。
DMV 大致分兩類:
- 正在執行中的查詢
- 已執行完畢的查詢(資料完全依賴 plan cache,計畫被踢出 → 指標一起消失)
正在執行中:sys.dm_exec_requests#
這支 DMV 是觀察「現在誰在跑、卡在哪裡」的起點。常用欄位:
start_time、command、total_elapsed_time、cpu_time、reads、writesplan_handle:用來抓執行計畫sql_handle:用來抓 T-SQL 文字blocking_session_id、wait_type:診斷封鎖與等待
DMV 是一次「快照」。要看到欄位變化,必須再查一次。
把它跟 sys.dm_exec_query_plan()、sys.dm_exec_sql_text() CROSS APPLY 起來才好用:
SELECT dest.text,
       deqp.query_plan,
       der.cpu_time,
       der.logical_reads,
       der.writes
FROM sys.dm_exec_requests AS der
    CROSS APPLY sys.dm_exec_query_plan(der.plan_handle) AS deqp
CROSS APPLY sys.dm_exec_sql_text(der.plan_handle) AS dest;已執行完畢:sys.dm_exec_query_stats#
聚合記錄每個 plan 的執行統計:
execution_count、last_execution_timetotal_logical_reads/last_logical_reads/min_*/max_*- 同樣有 CPU、寫入、執行時間
針對特定物件還有專用版本:
sys.dm_exec_procedure_stats:Stored Proceduresys.dm_exec_function_stats:UDFsys.dm_exec_trigger_stats:Trigger
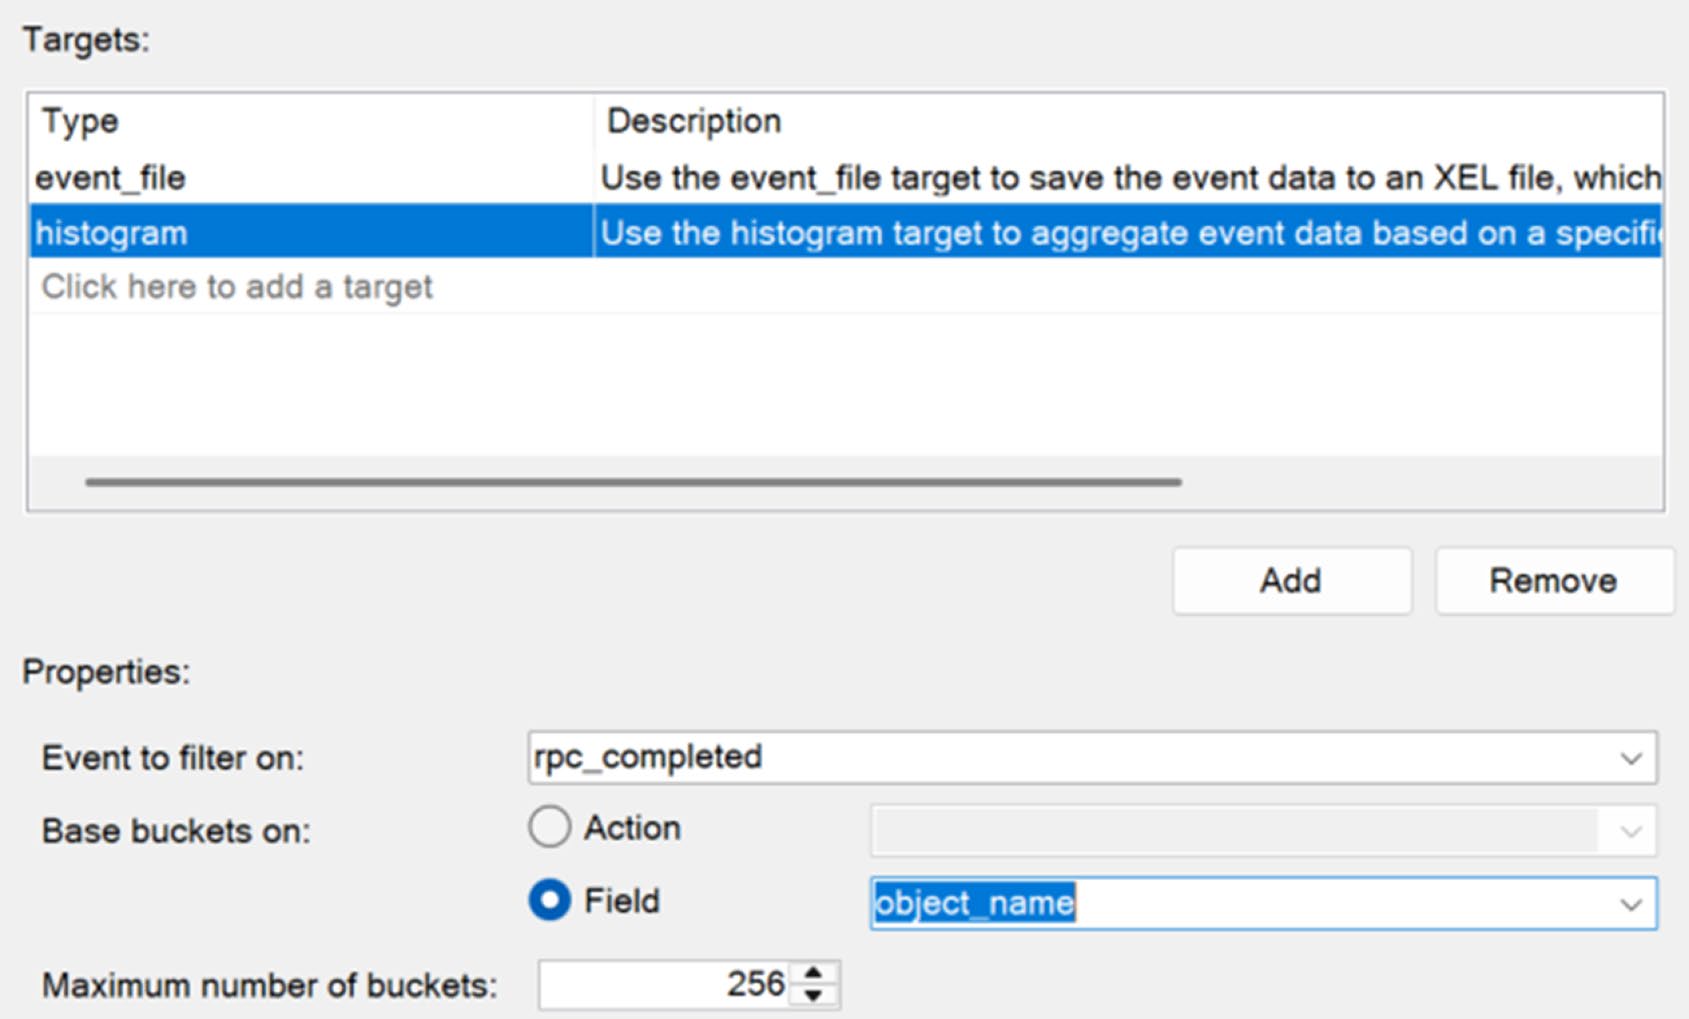
Figure 3-16: Counting all occurrences of stored procedures using the
這些指標是 聚合值,無法區分「凌晨 2 點」與「凌晨 3 點」的同一個查詢;要做時間切片,得自己定期取樣。
Query Store#
從 SQL Server 2016 開始引入,以資料庫為單位 啟用:
- 在資料庫內保存查詢的指標與執行計畫
- 預設以 60 分鐘為一個聚合區間,可比對「同一查詢在不同時段」的變化
- 即使 plan cache 被刷掉,Query Store 仍保有歷史資料
詳細用法在第 6 章。
Extended Events#
從 SQL Server 2012 起 Extended Events(XE)正式取代 Trace。不只是查詢指標,也是觀察 SQL Server 整體行為的主要工具。
核心概念#
- Session:一份監測組態,定義要抓哪些事件、輸出去哪
- Event:實際發生的活動(query 完成、recompile、deadlock、wait…)
- Global Field(Action):在事件之外額外蒐集的欄位(例如
query_hash、query_plan_hash) - Event Field:每個事件自己附帶的欄位,部分為選填
- Predicate:篩選條件,等同 WHERE,會在擷取時就濾掉
- Target:輸出目的地,預設 Ring Buffer(記憶體)
production 環境 不要把 Target 設成 Ring Buffer。它直接挖 SQL Server 與 OS 的記憶體;改用 file target 較安全。
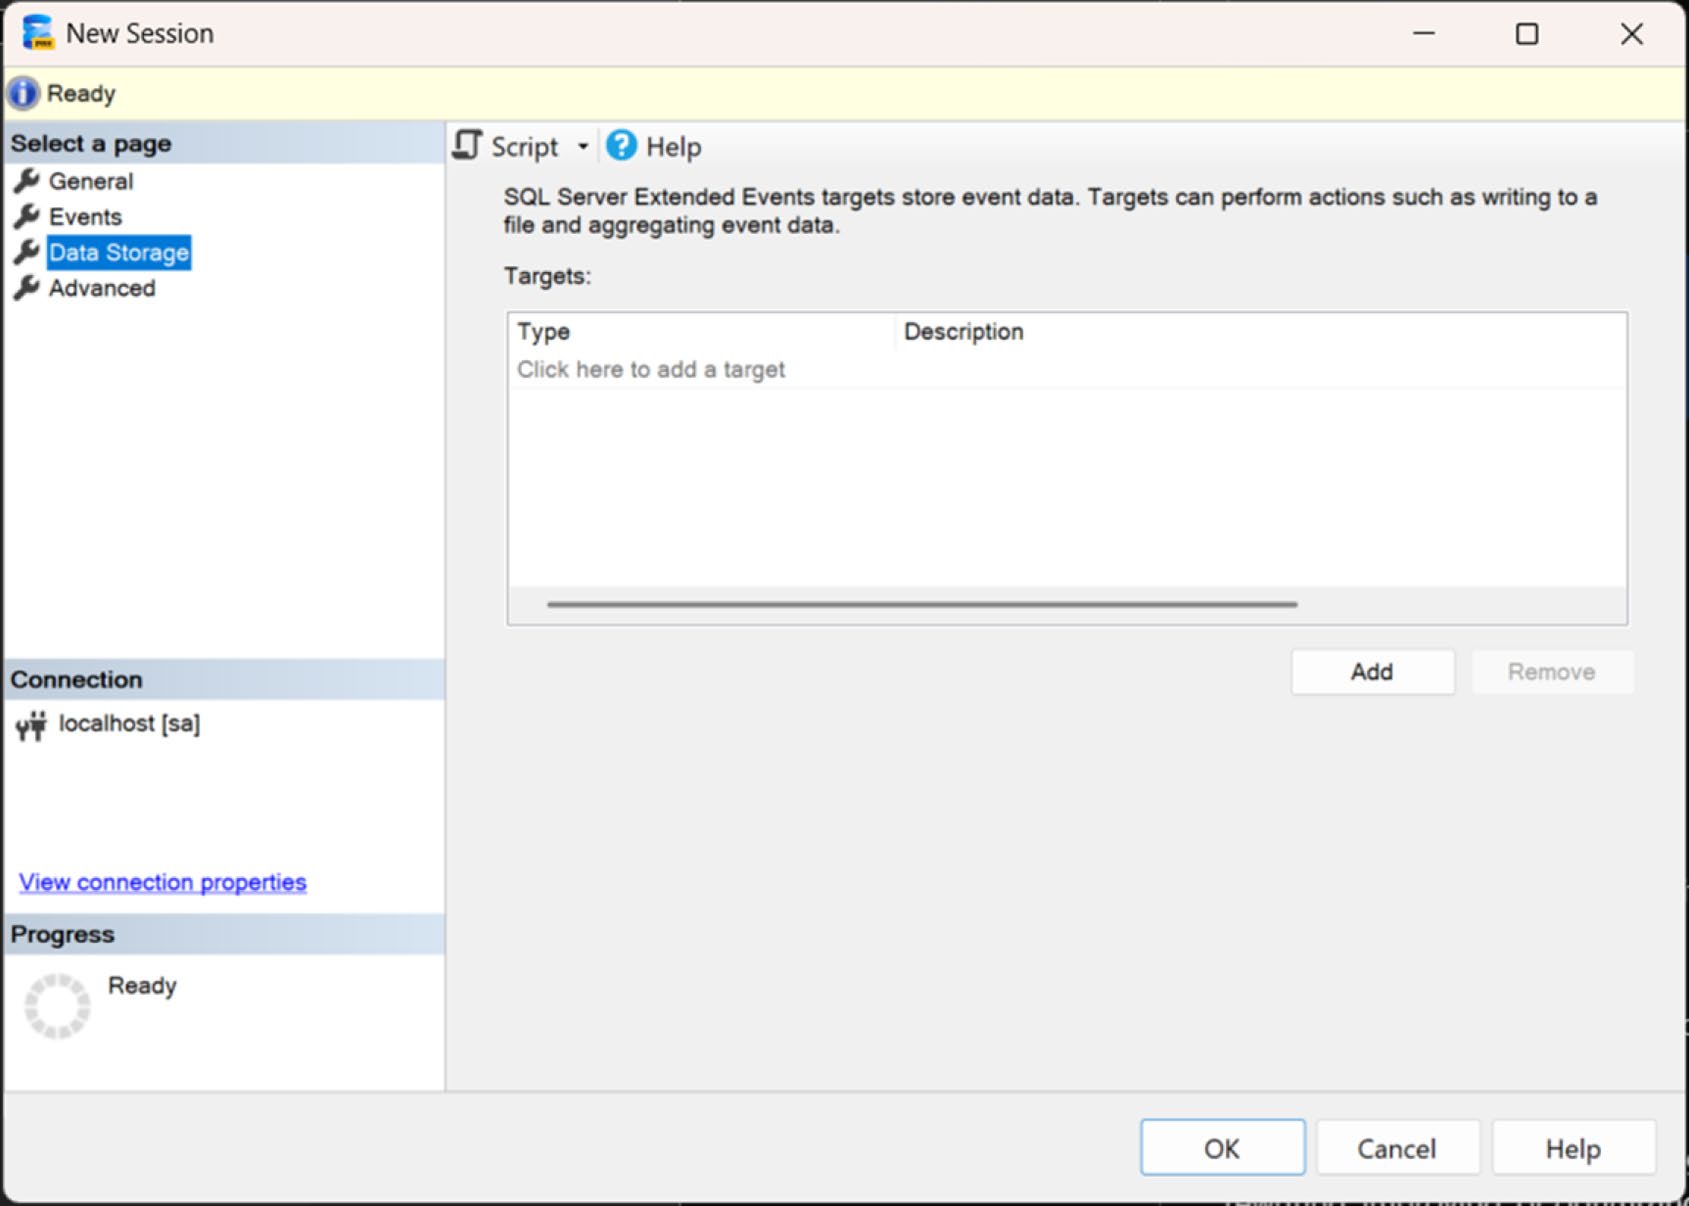
Figure 3-14: The Data Storage or Targets page
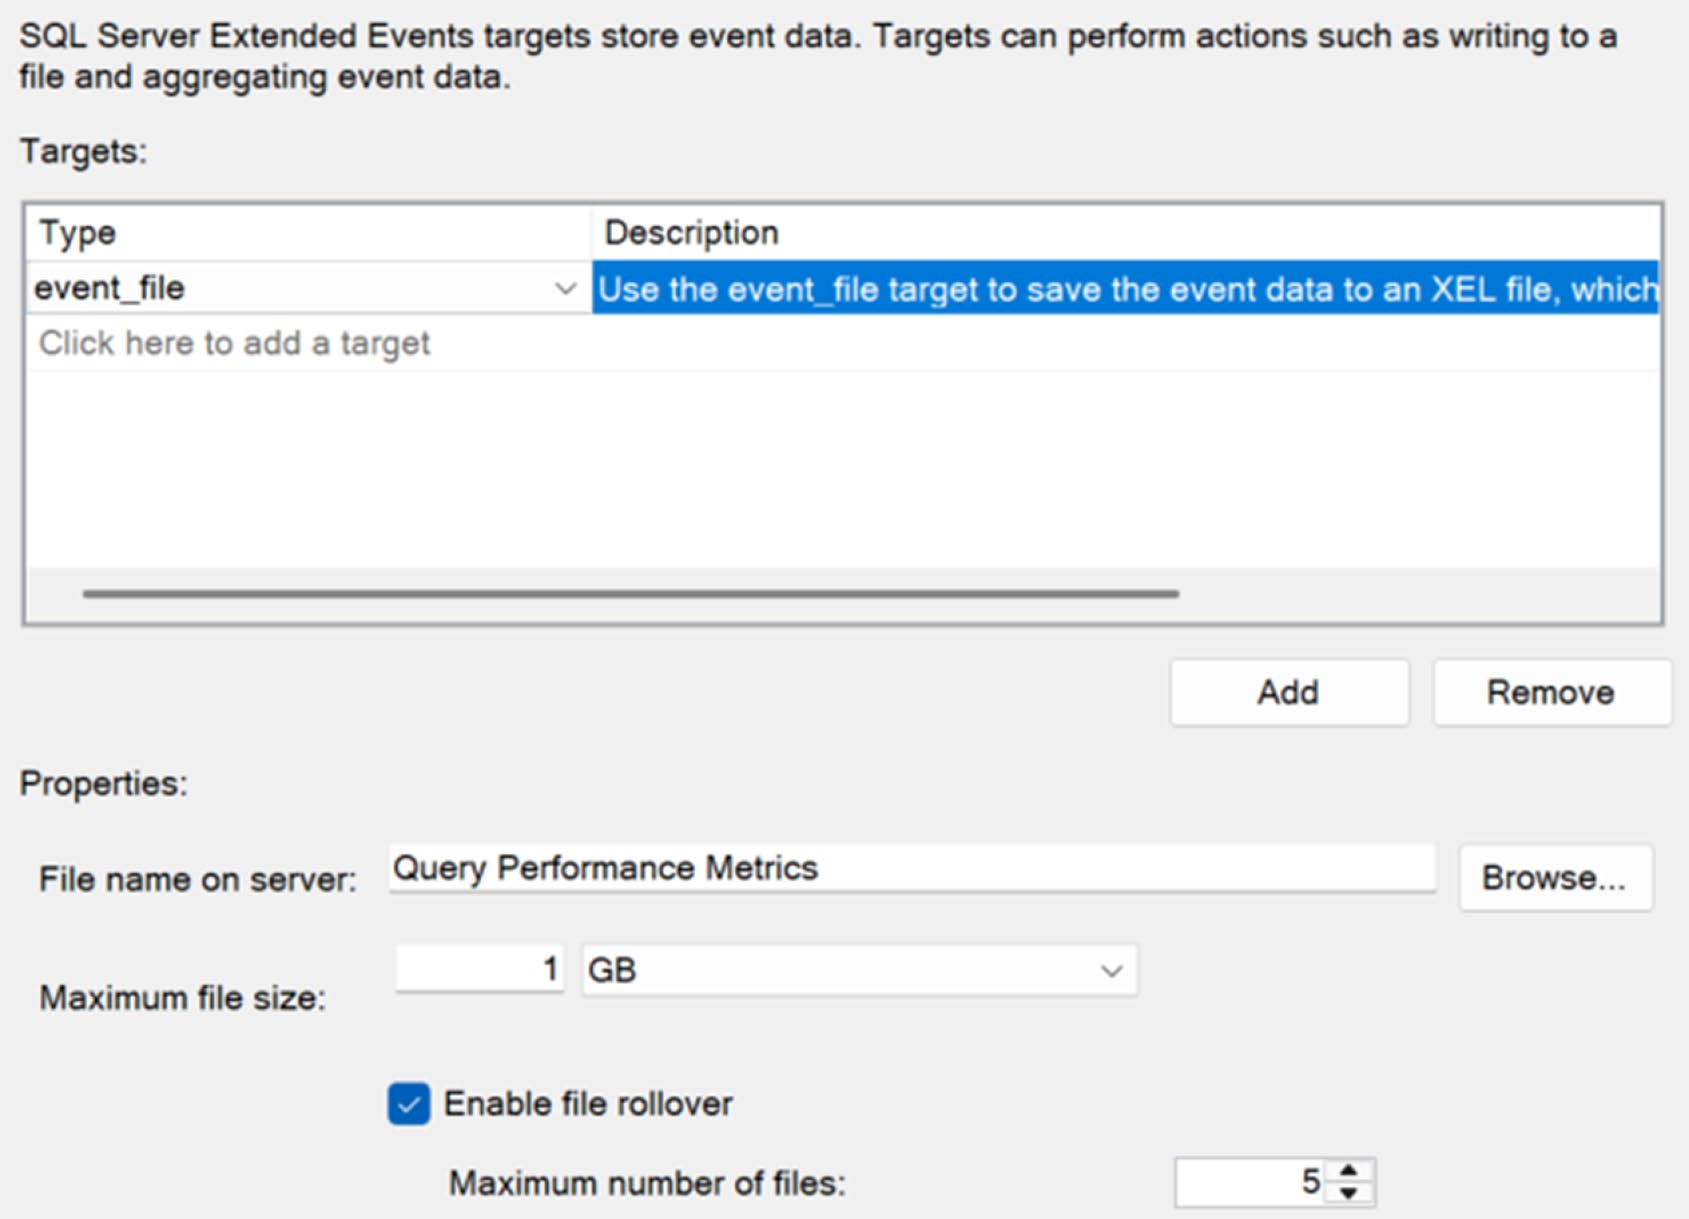
Figure 3-15: Selecting the event_file Target
建立 Session#
SSMS Object Explorer:Management → Extended Events → Sessions → New Session...
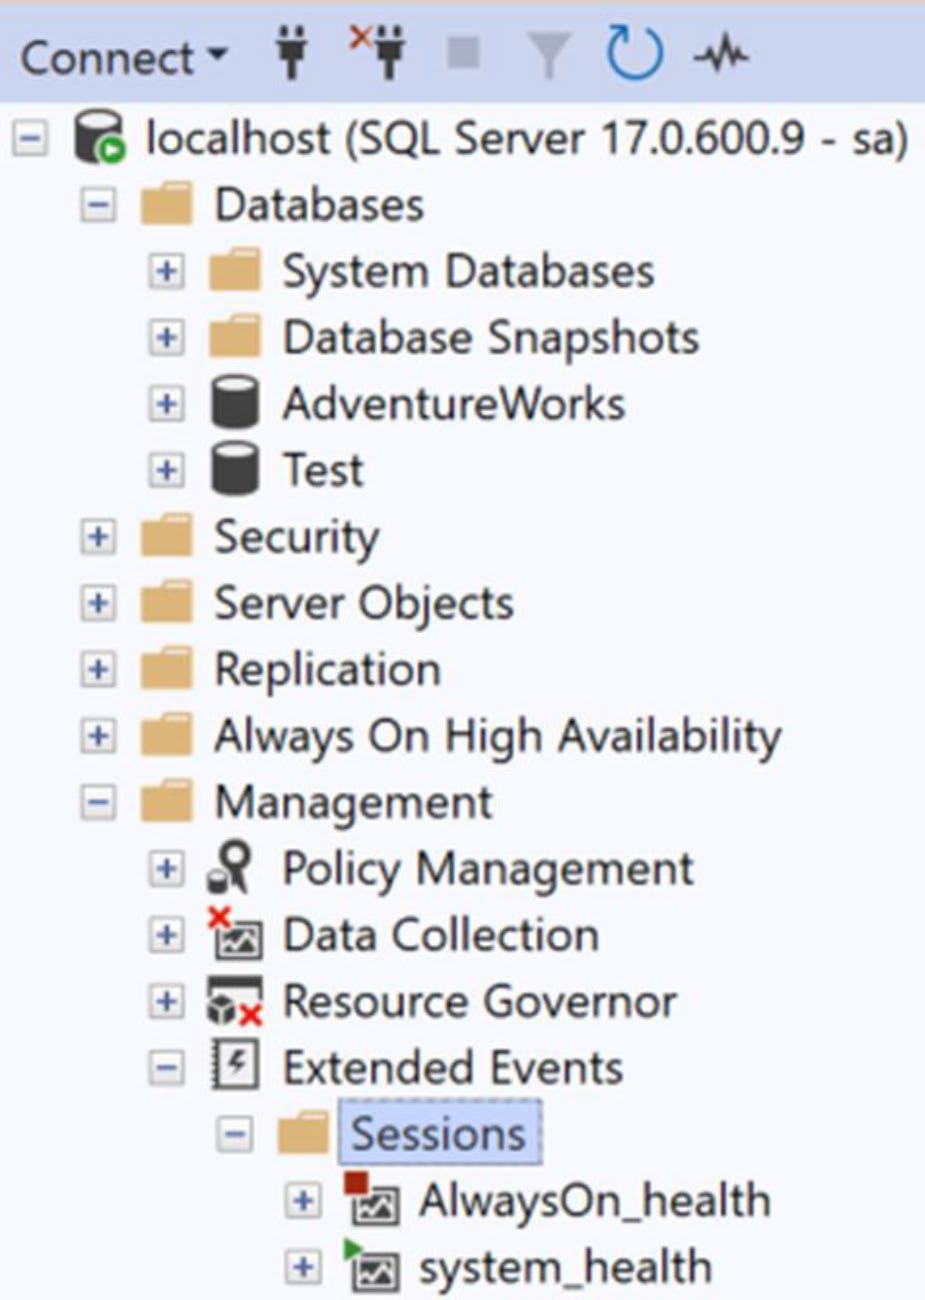
Figure 3-2: The Object Explorer showing where Extended Events Sessions
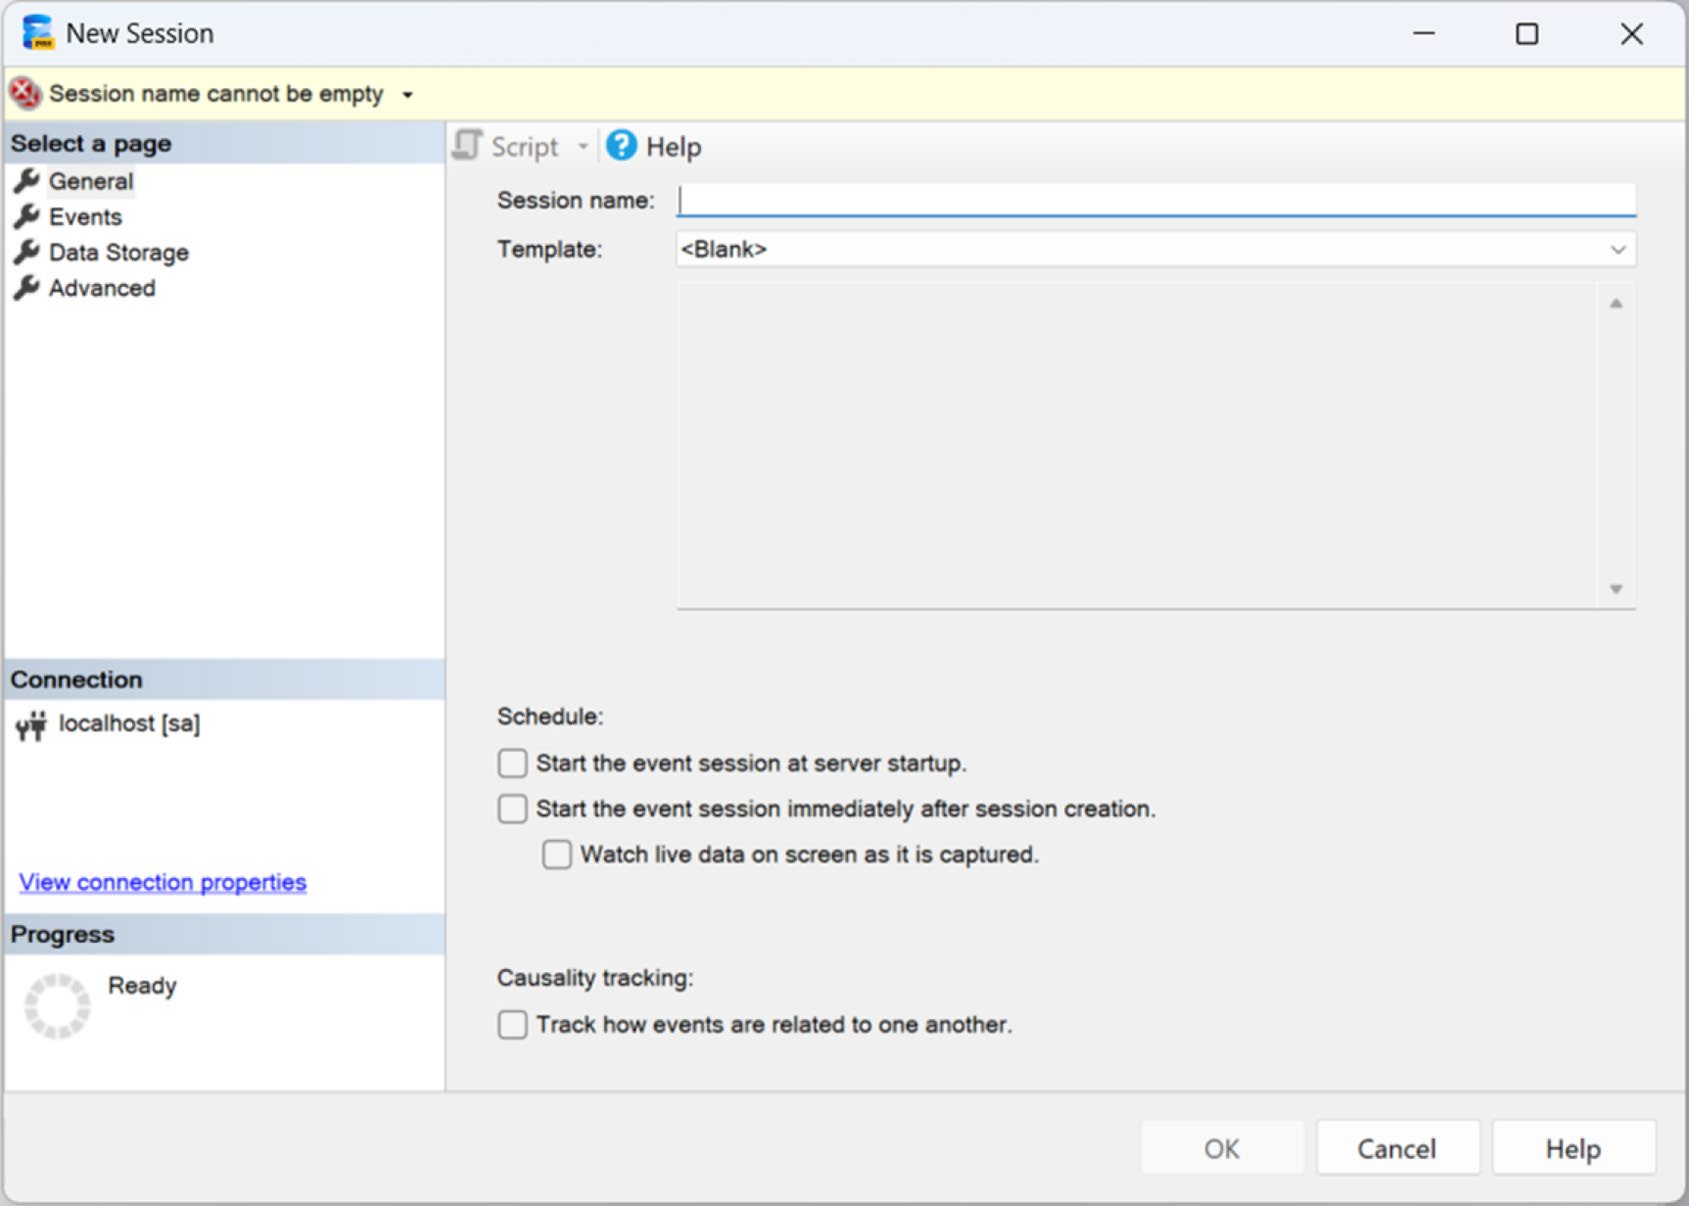
Figure 3-3: The New Session window
只要 Session 名稱與至少一個 Event 就能建立。也可以用 Template 直接套:
- TSQL:相當於 Profiler 的對應模板
- Query Detail Tracking:擷取批次、語句、RPC 完成(已過濾系統查詢)
- Query Batch Sampling:以 20% 取樣,降低觀測負擔
- Query Wait Statistic:含內外部等待,並啟用 Causality Tracking
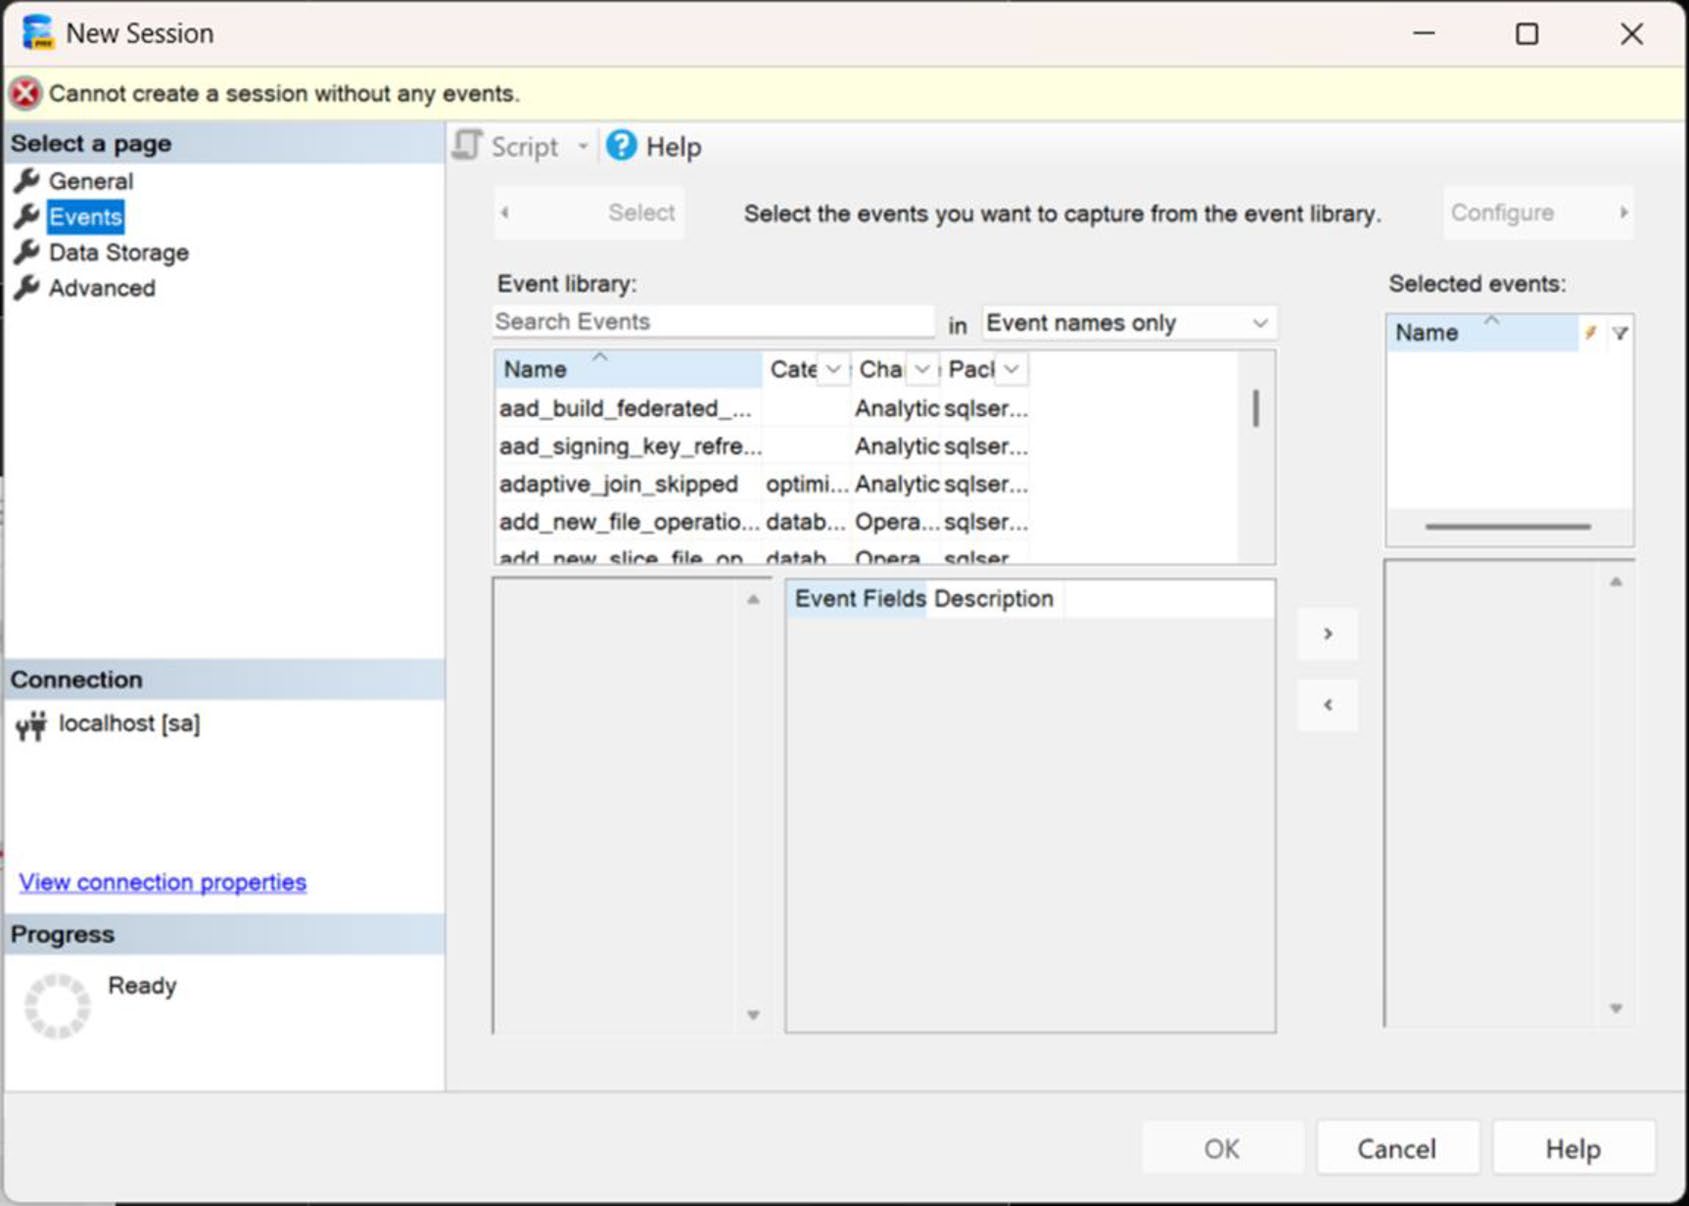
Figure 3-4: Session selection for Extended Events
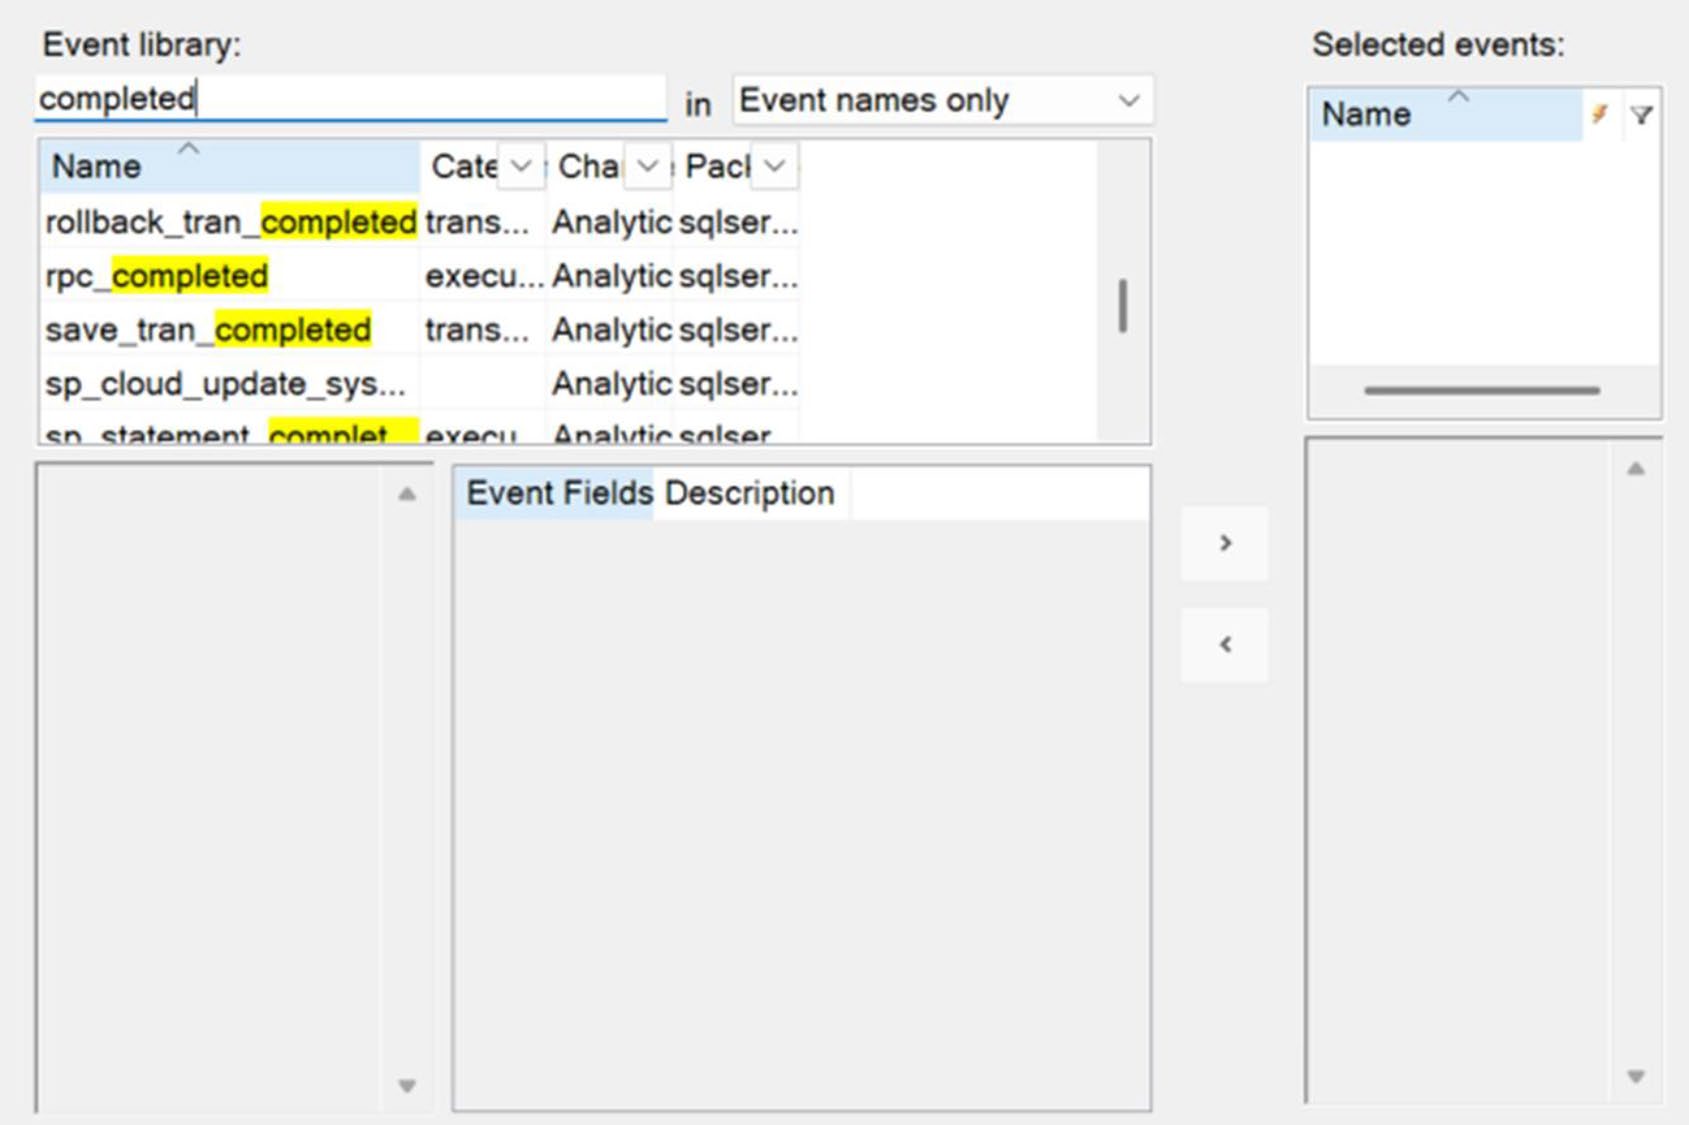
Figure 3-5: Events filtered to only those that have the phrase “completed”
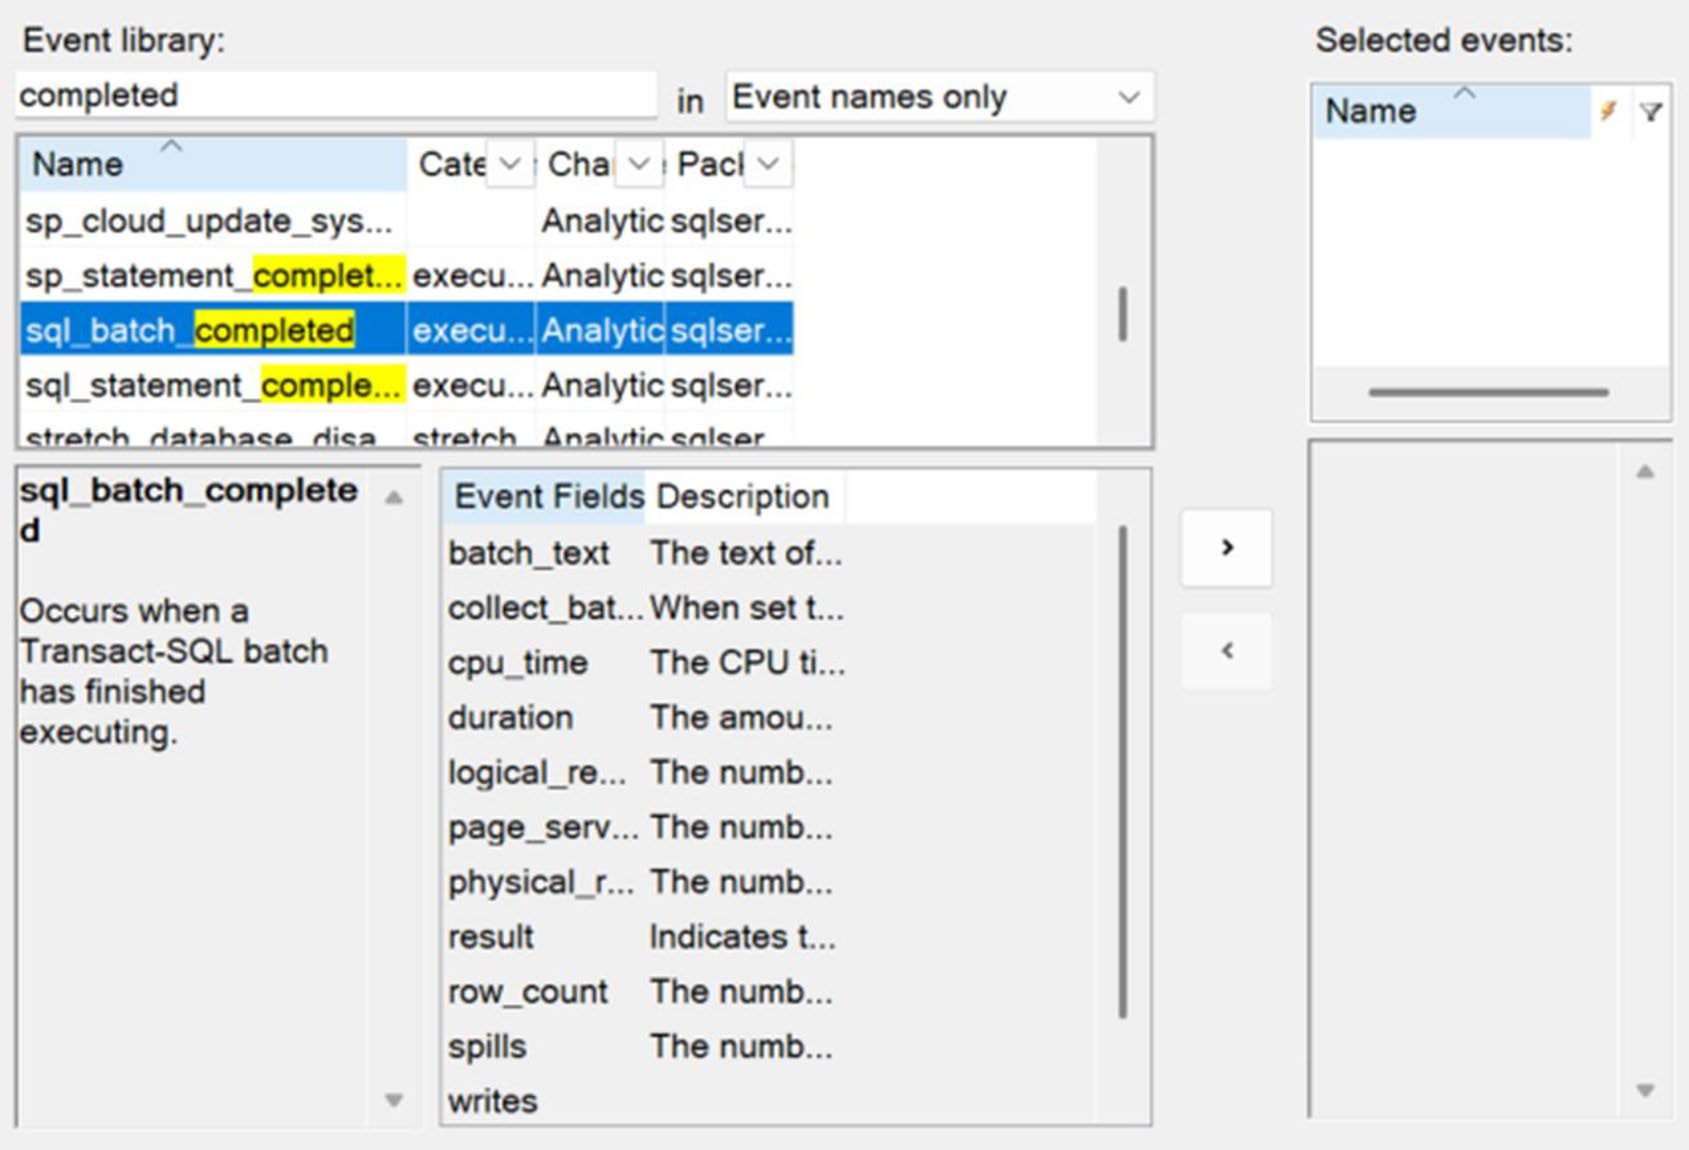
Figure 3-6: Initially clicking an Event in Extended Events
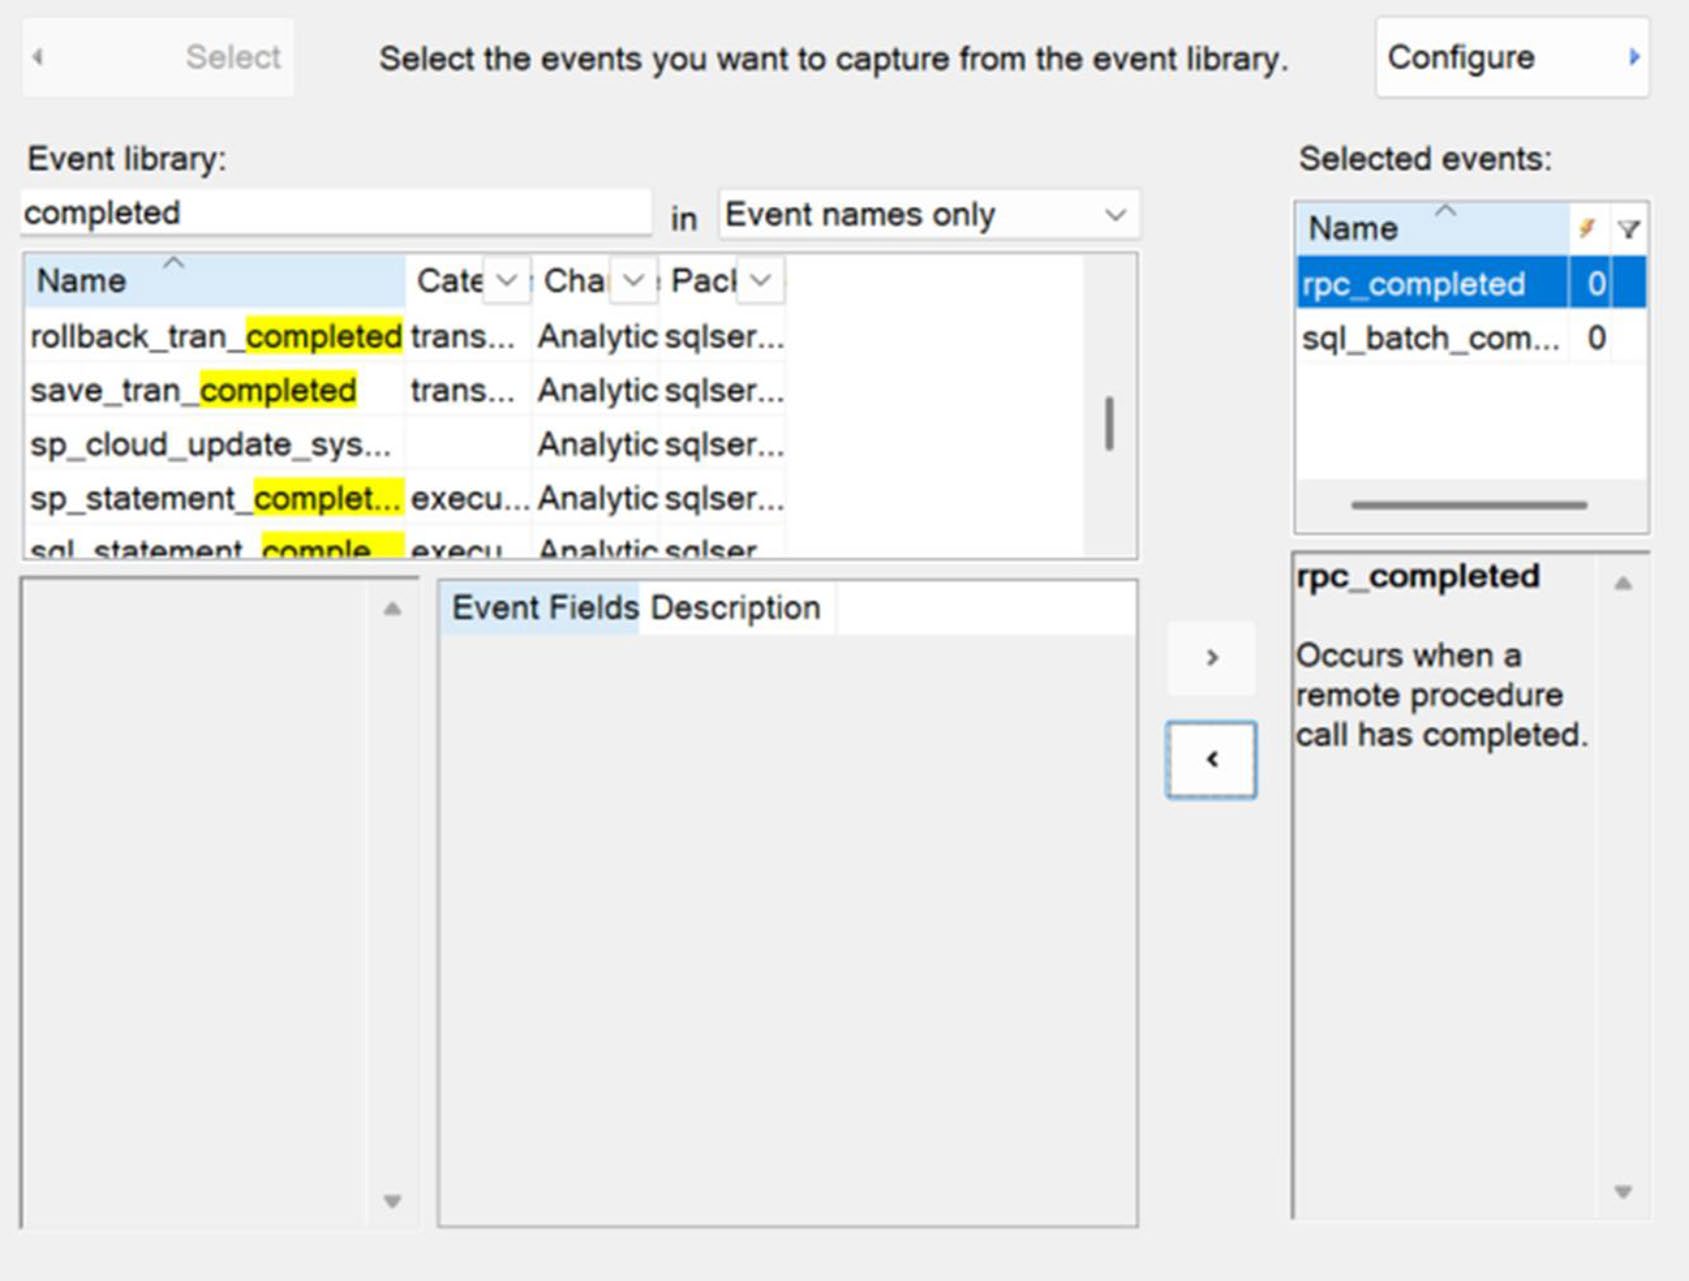
Figure 3-7: Two Events added to the Selected events list
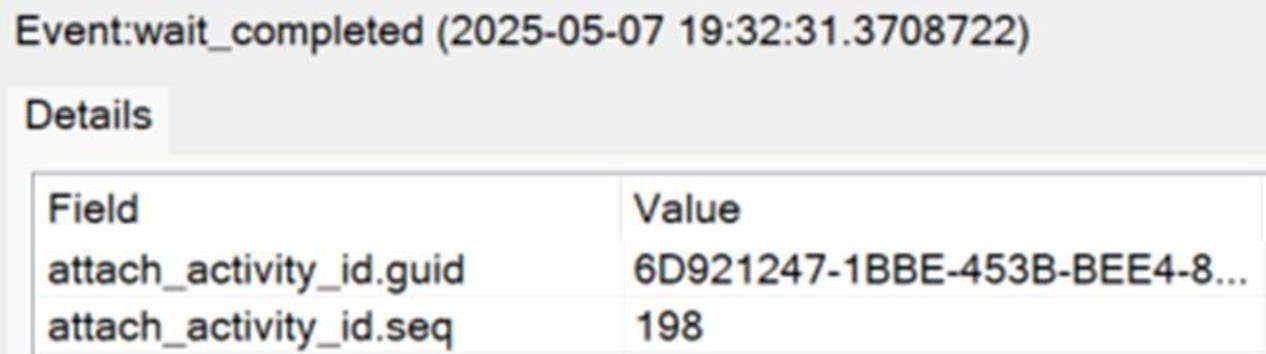
Figure 3-18: Causality Tracking fields added to event results
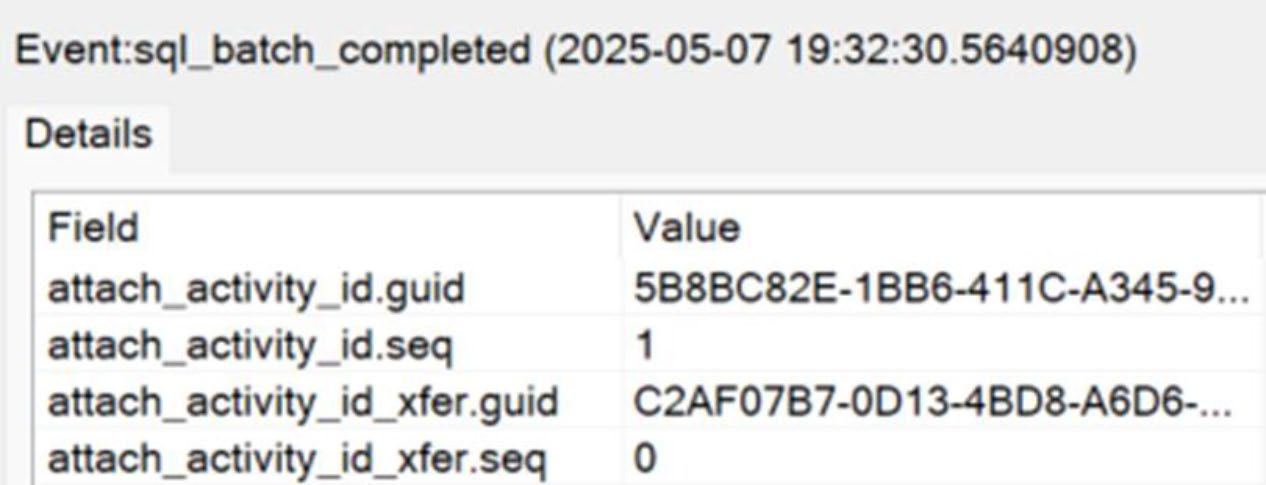
Figure 3-19: Parent GUIDs in Causality Tracking
為事件加 Action#
Action 是「附加欄位」。對查詢調校最常加的兩個:
query_hash:查詢指紋query_plan_hash:計畫指紋
兩者結合可在不同 session 間找到「結構相同的查詢」。
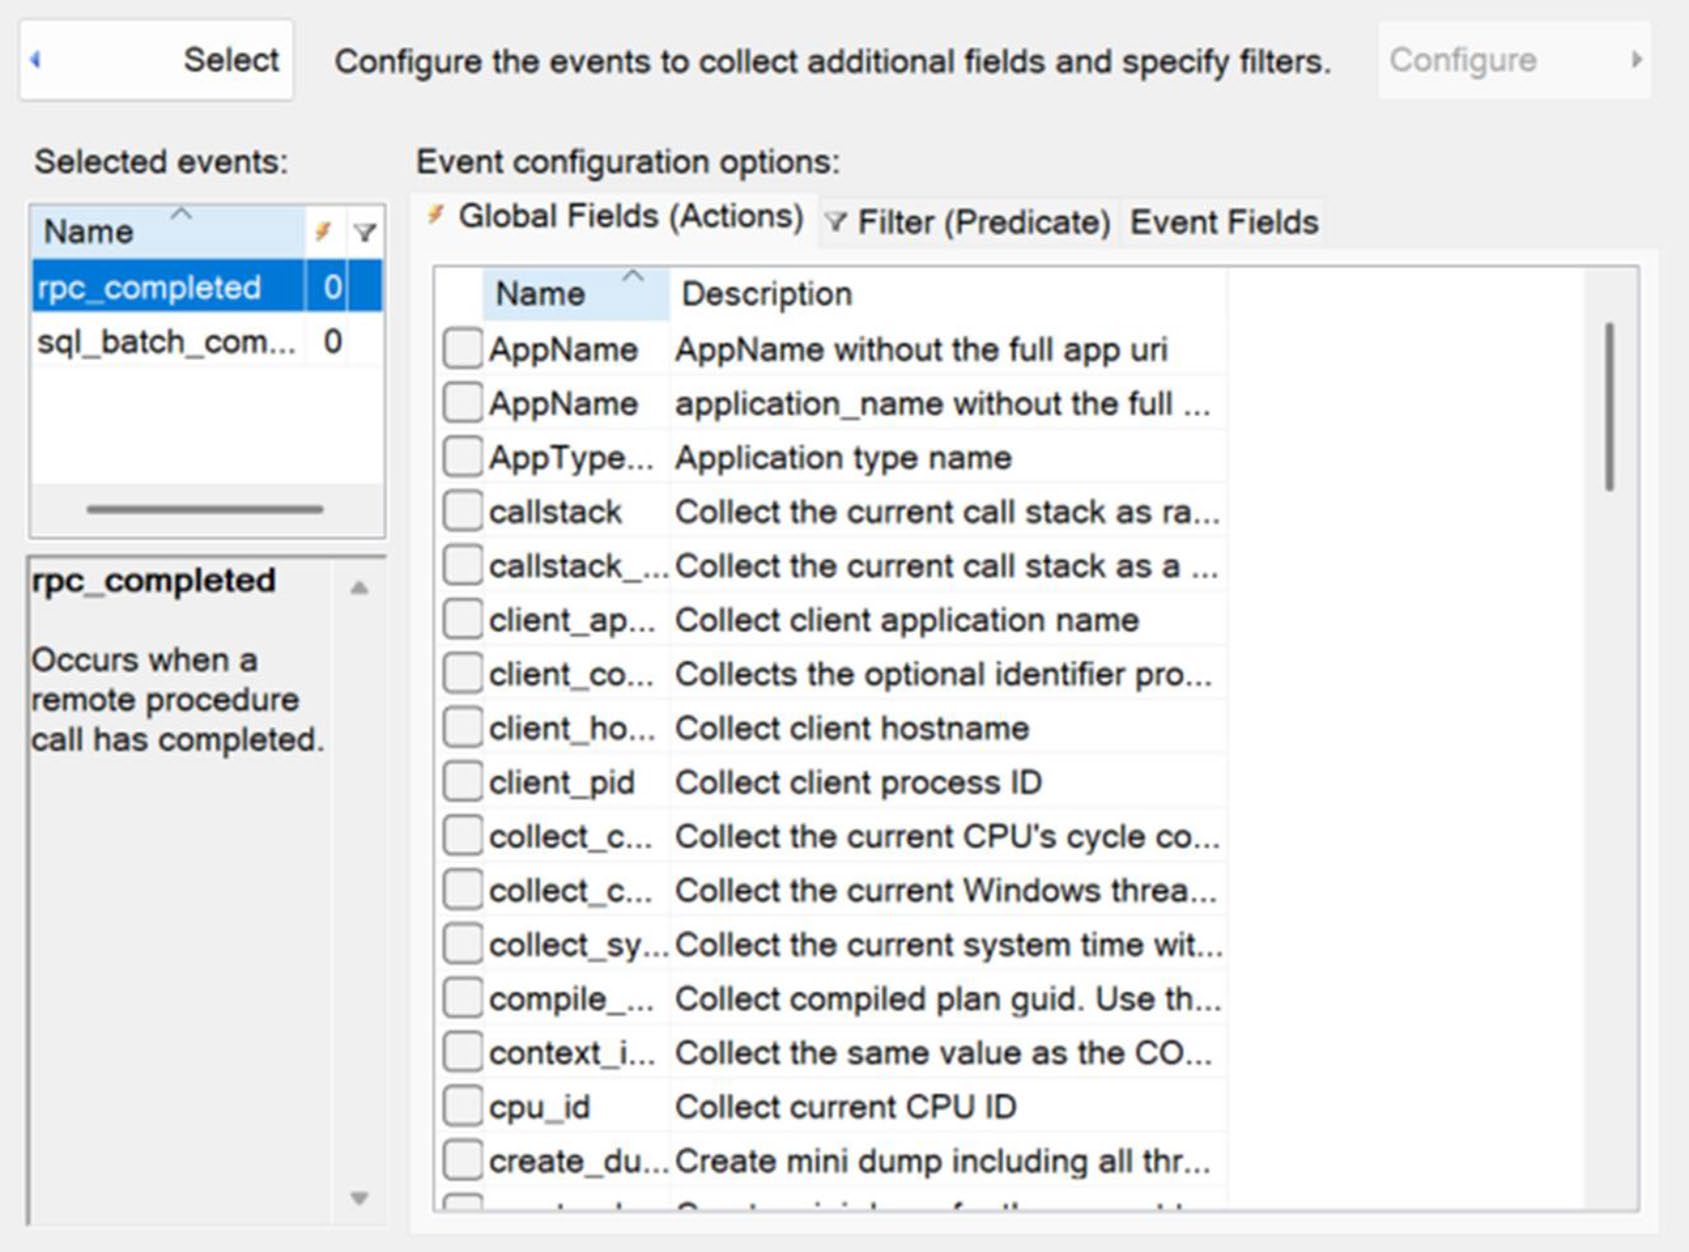
Figure 3-8: The Event configuration window
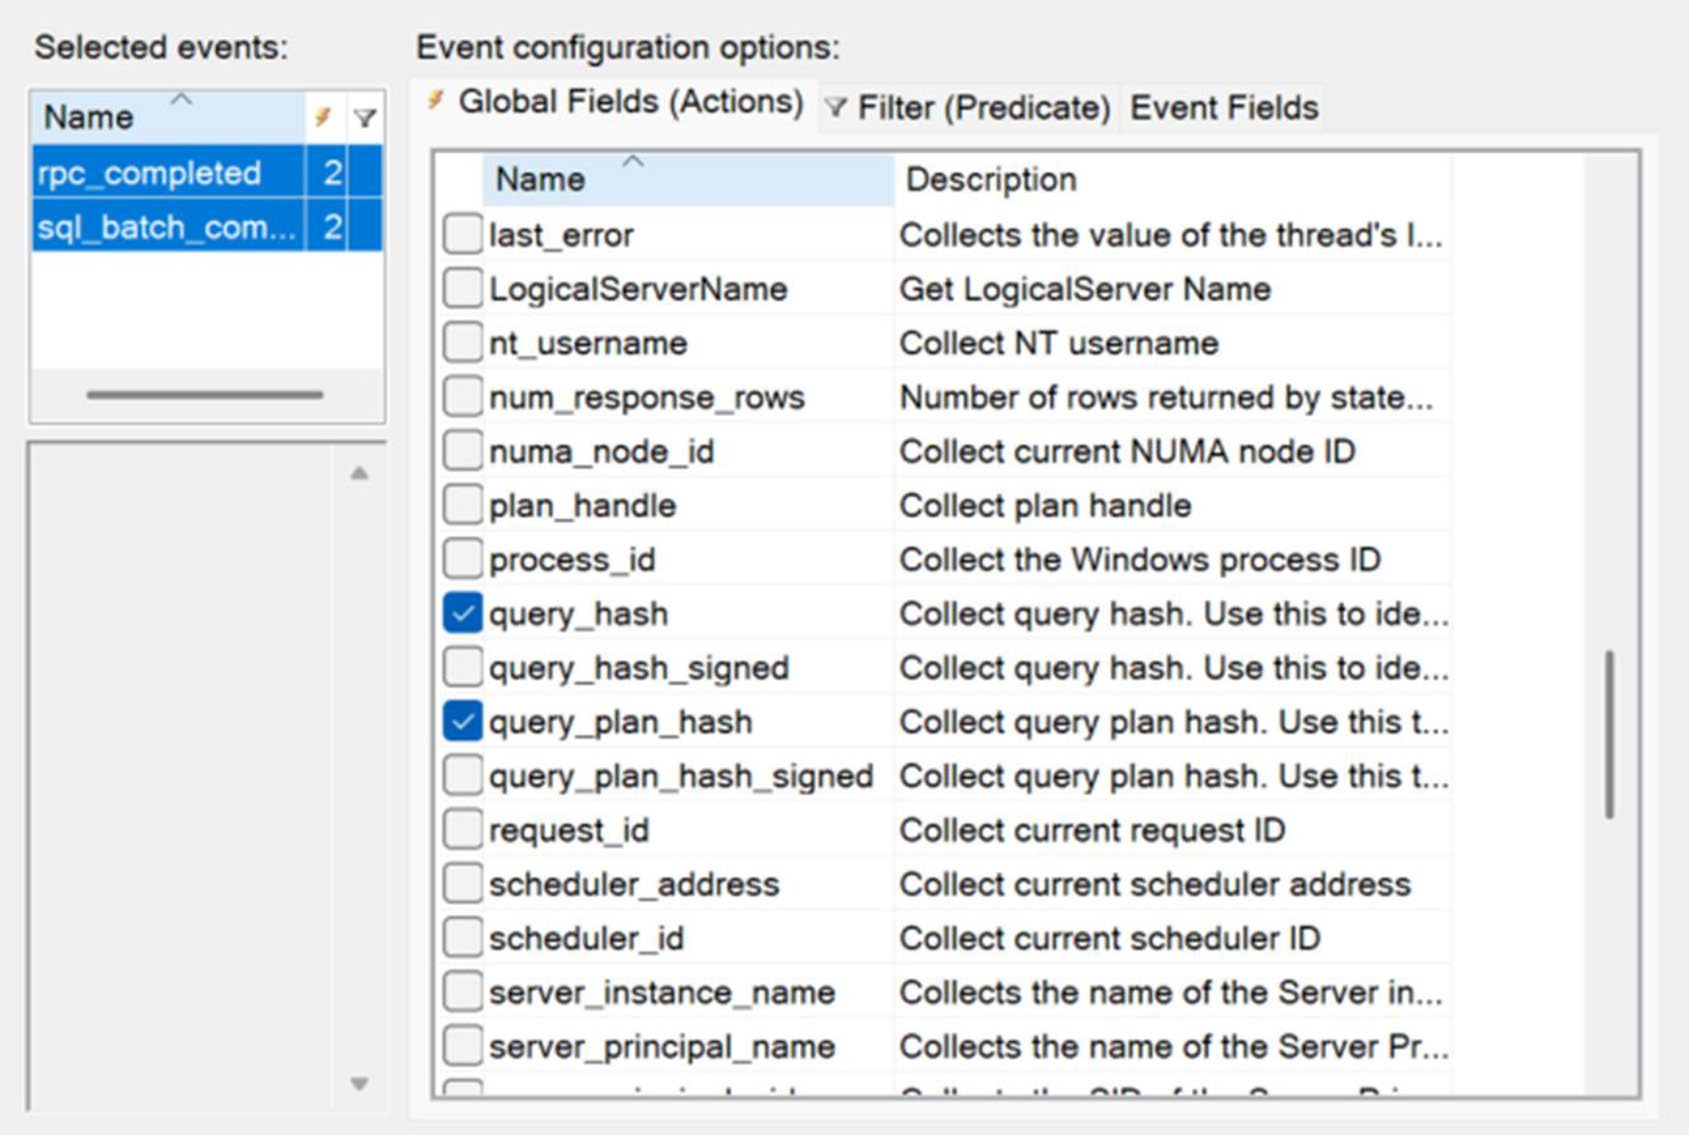
Figure 3-9: Selecting Global Fields for multiple Events
Predicate(過濾條件)#
Predicate 行為等同 SQL WHERE。
把「過濾性最強」的條件放最前面——XE 是 在擷取階段 就過濾,越早濾掉越省成本。
例子:只抓 AdventureWorks 上跑超過 1,000 微秒的查詢,用 AND 串接條件。
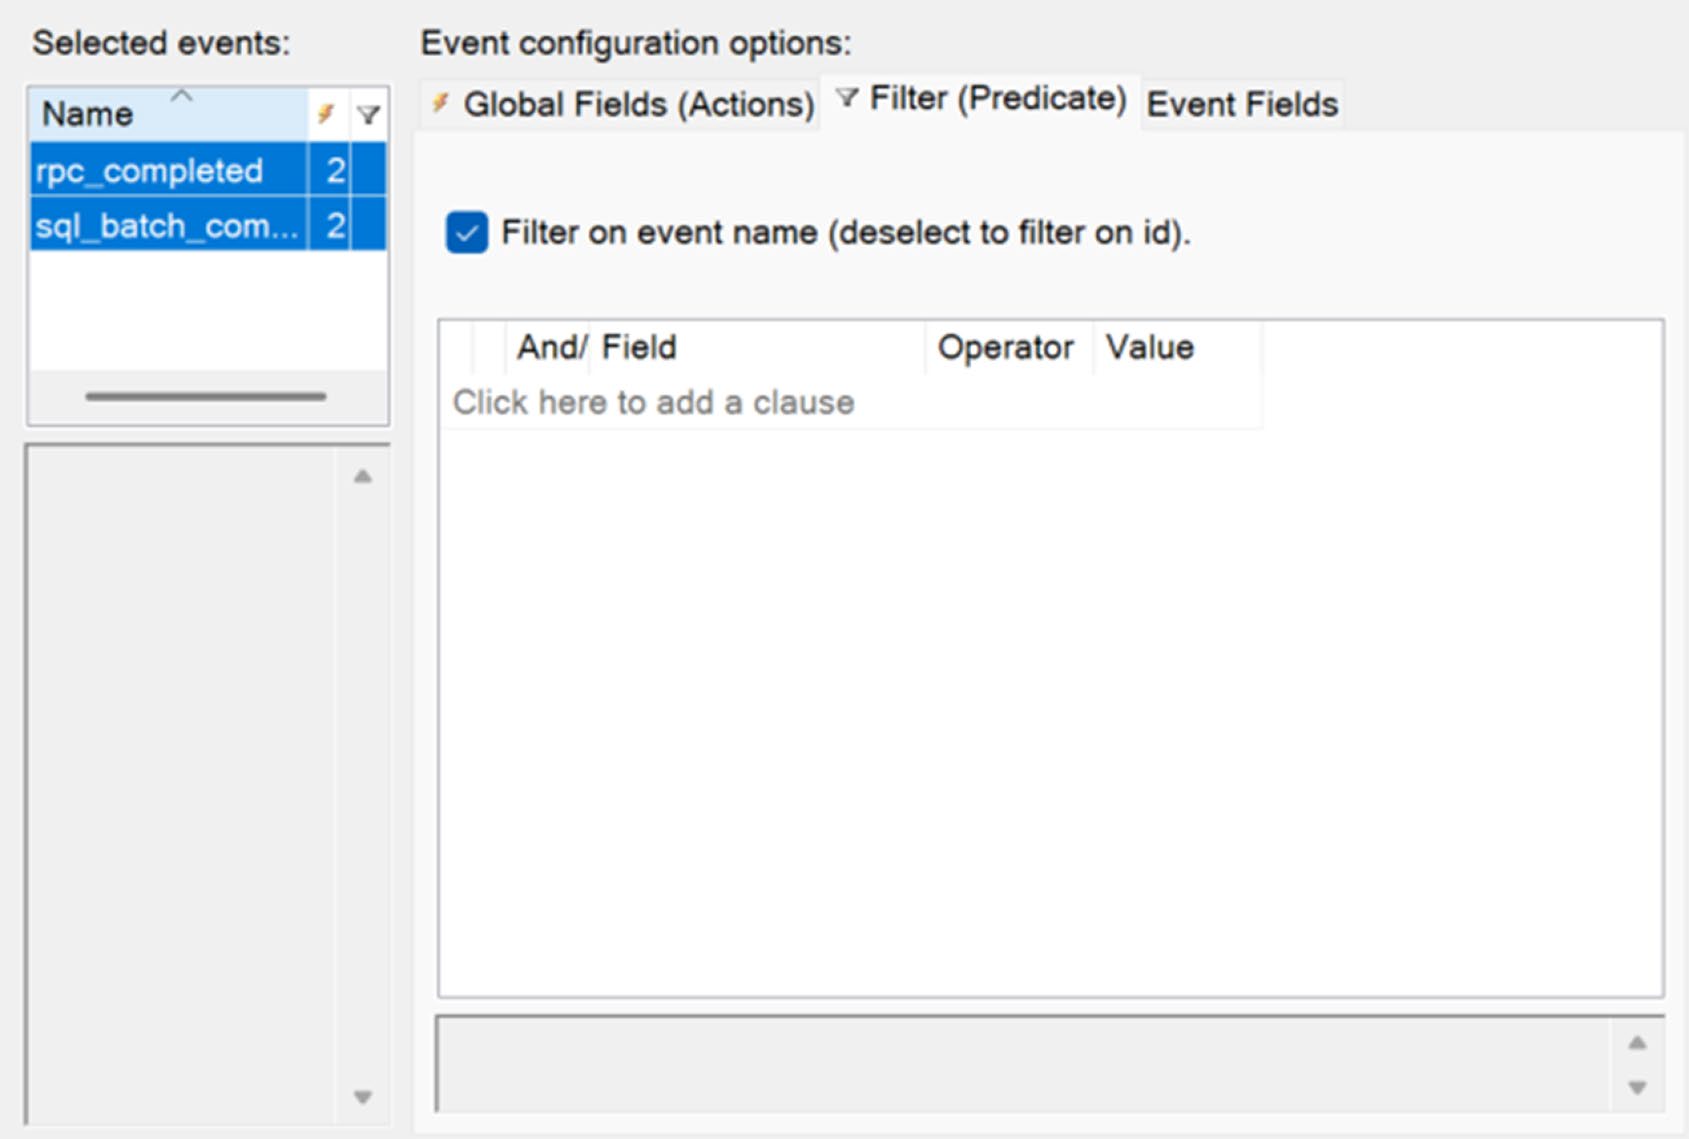
Figure 3-10: The Filter or Predicate tab for configuring Events
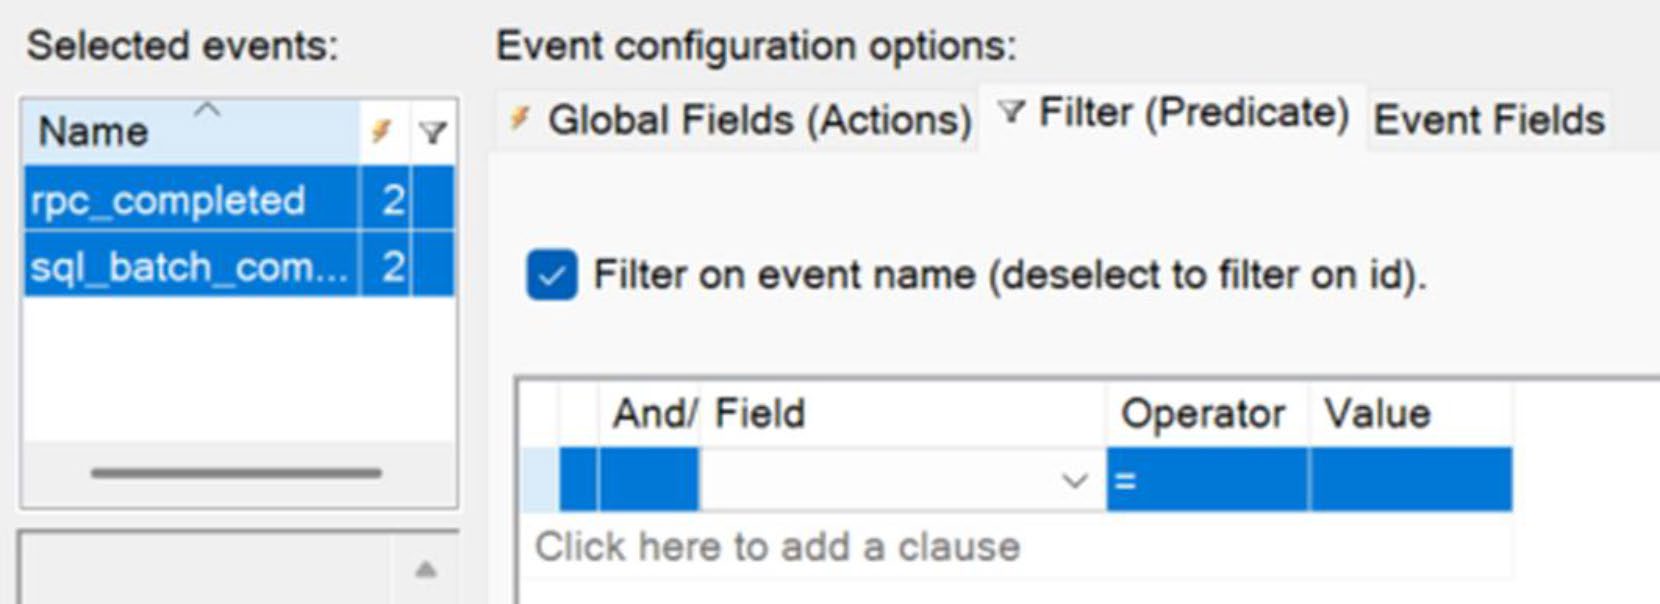
Figure 3-11: Adding a Predicate to a set of Events
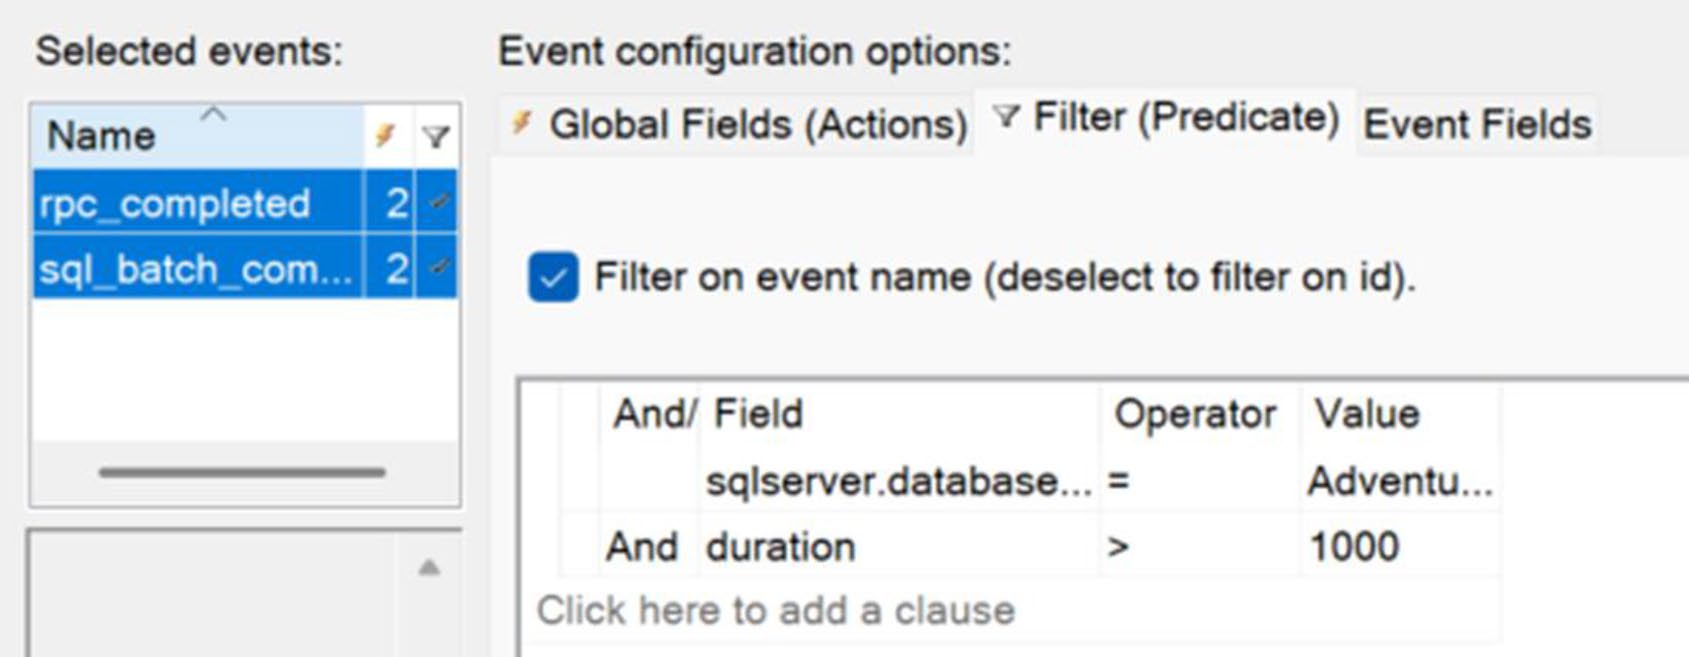
Figure 3-12: Multiple filter criteria for Events
Event Fields#
每個 Event 有「必收」與「選收」欄位。
- 例如
rpc_completed預設會帶duration、object_name、row_count statement為選填但預設啟用——關掉可省成本,但會看不到參數值output_parameters、data_stream預設關閉,必要才開
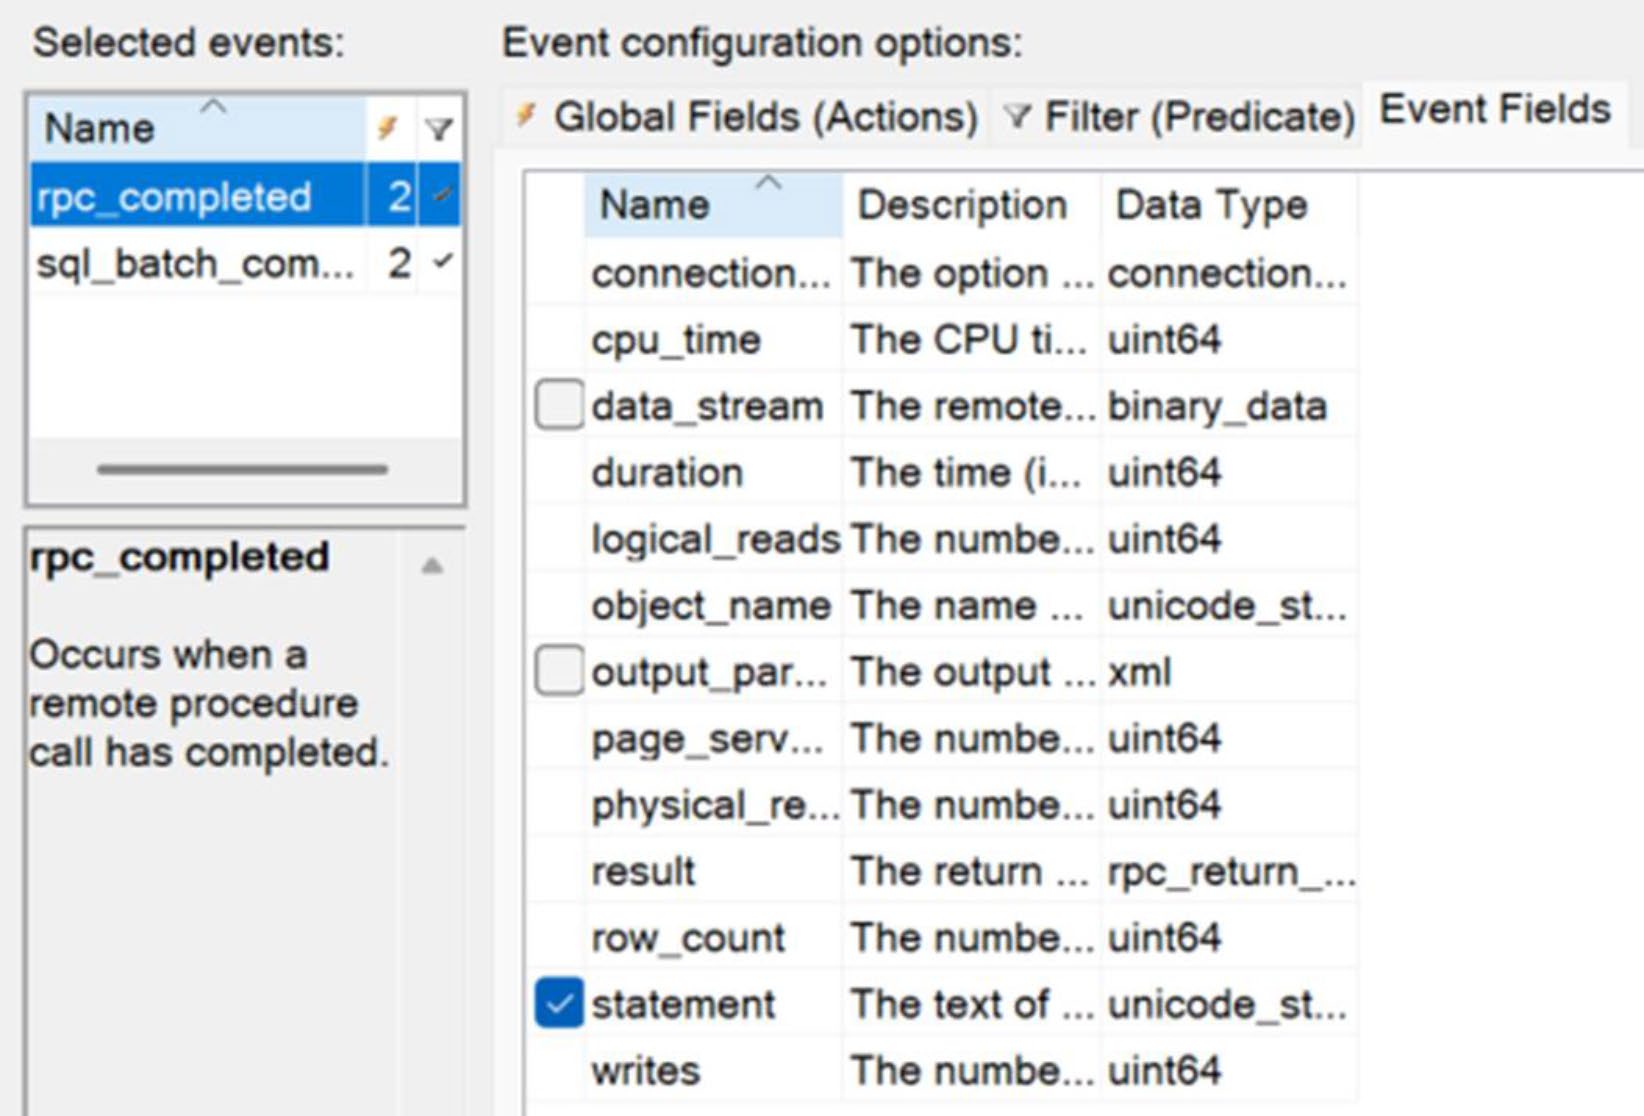
Figure 3-13: Event Fields for the rpc_completed event
Live Data 視窗#
Session 啟用後,可開 Live Data 視窗即時瀏覽事件流。對剛建好 Session 的初步驗證非常方便。
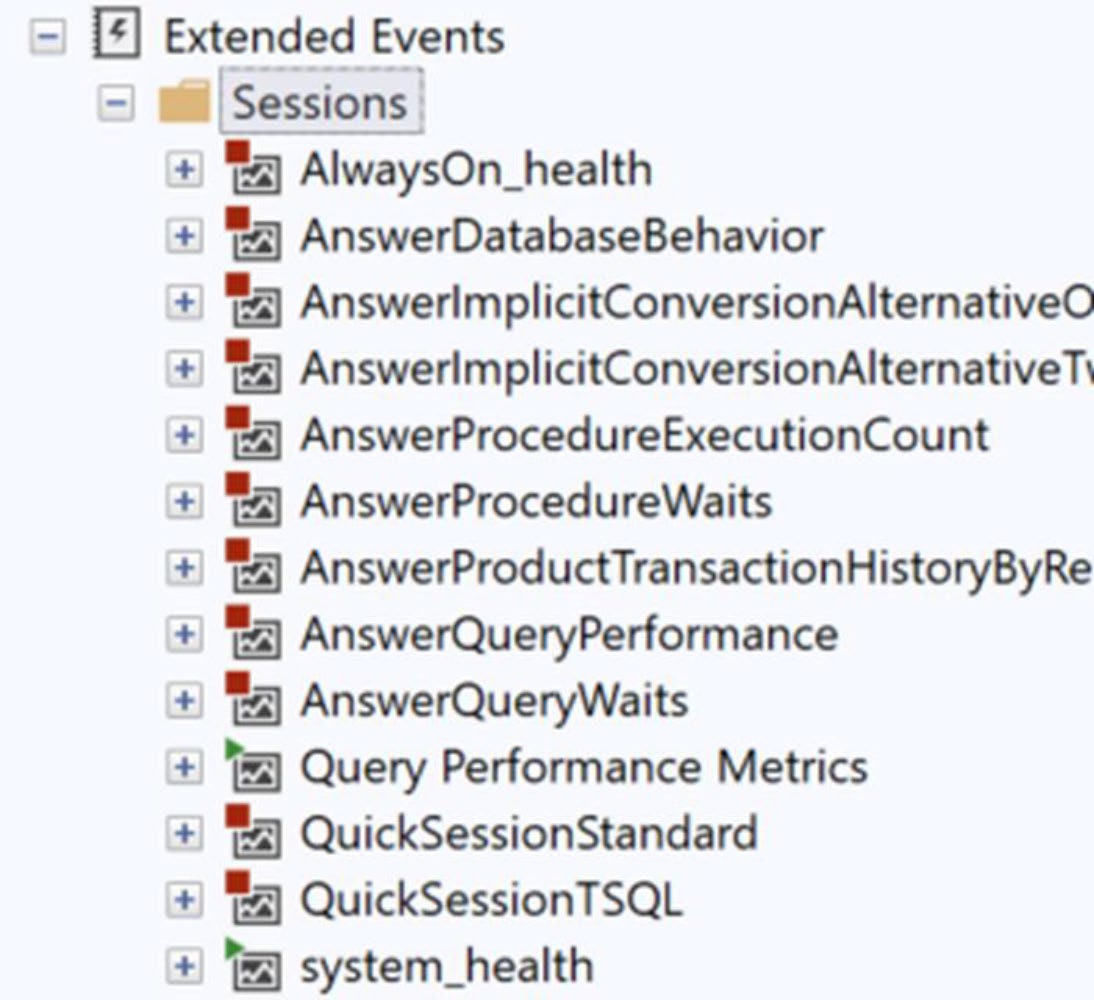
Figure 3-17: Extended Events Sessions in the Object Explorer window
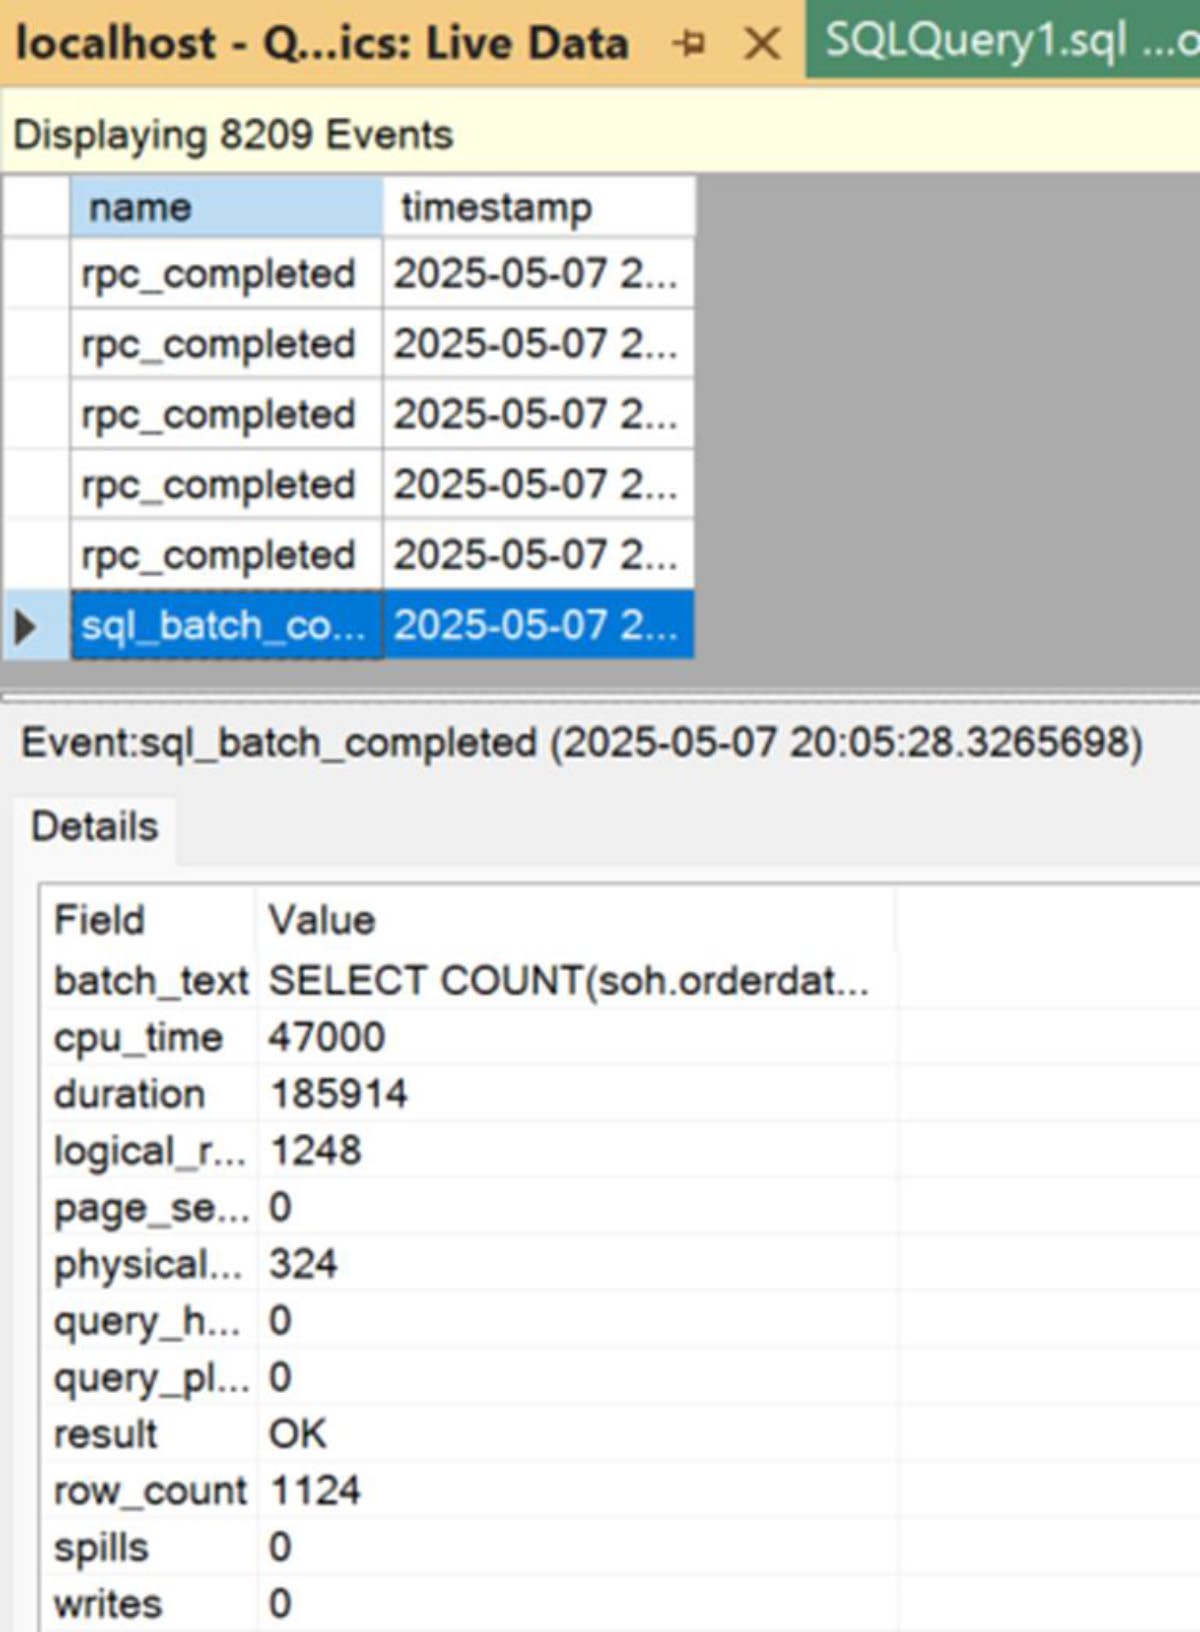
Figure 3-21: Live Data window initial view
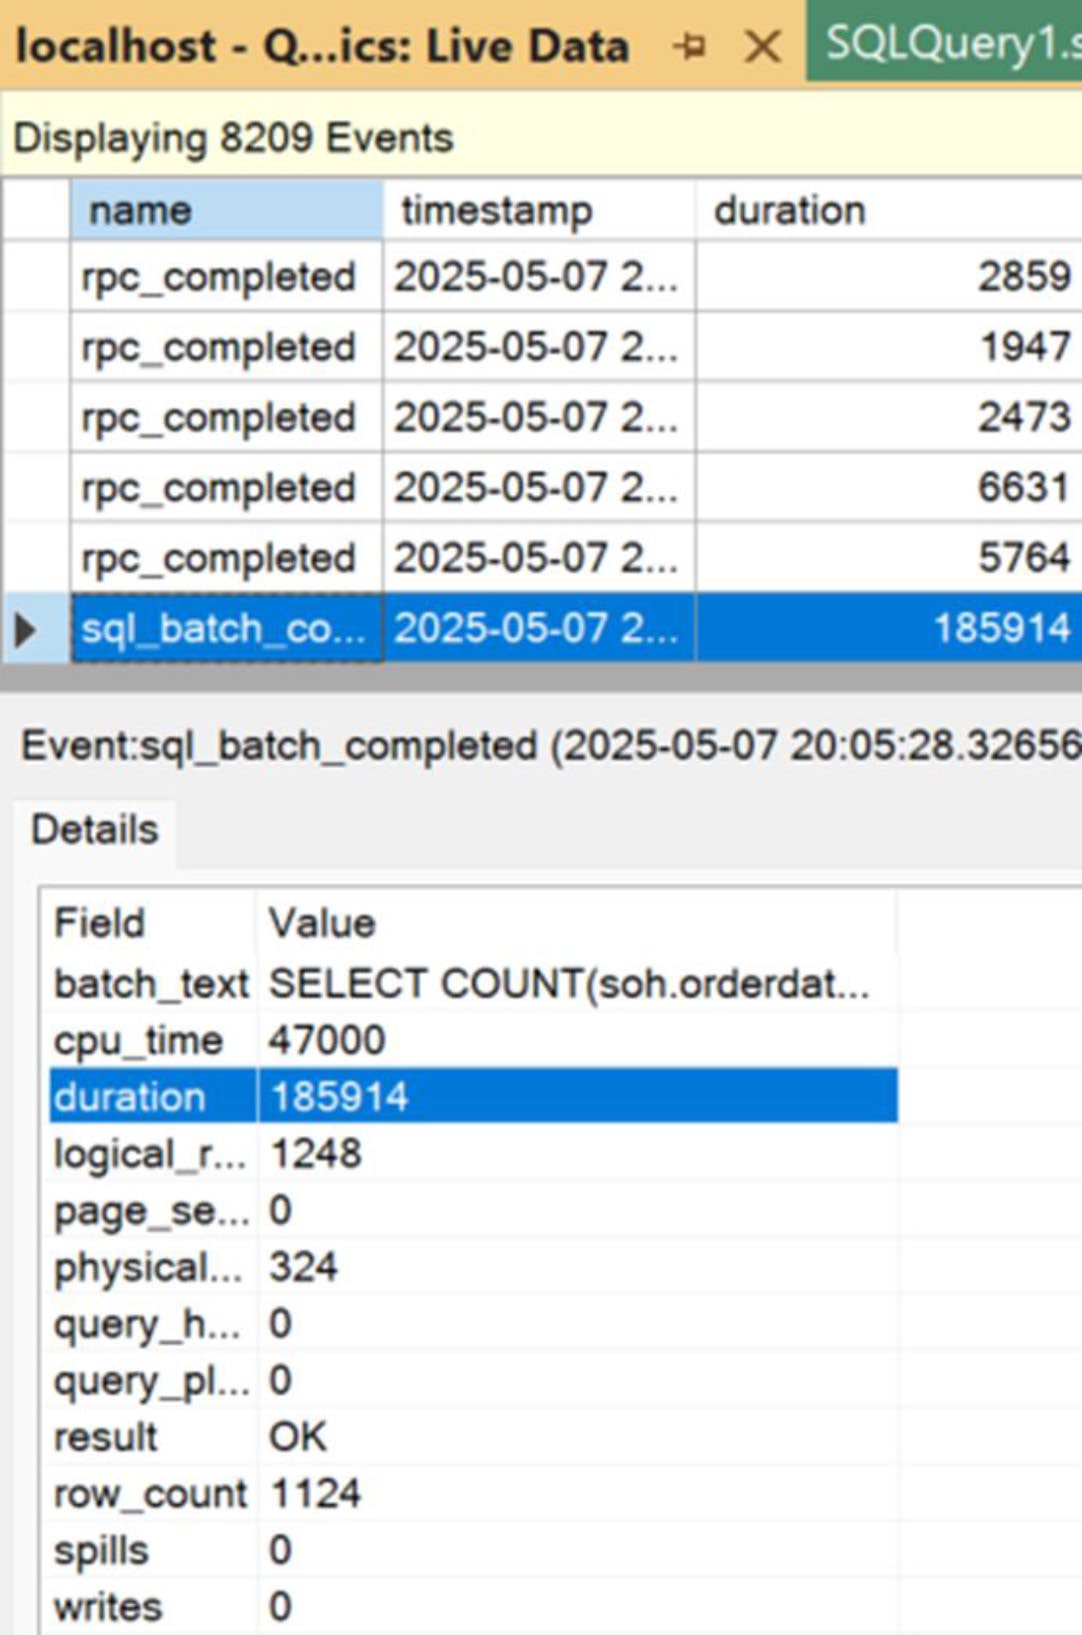
Figure 3-22: Adding fields to the grid to make for easier viewing

Figure 3-23: The Live Data Explorer toolbar
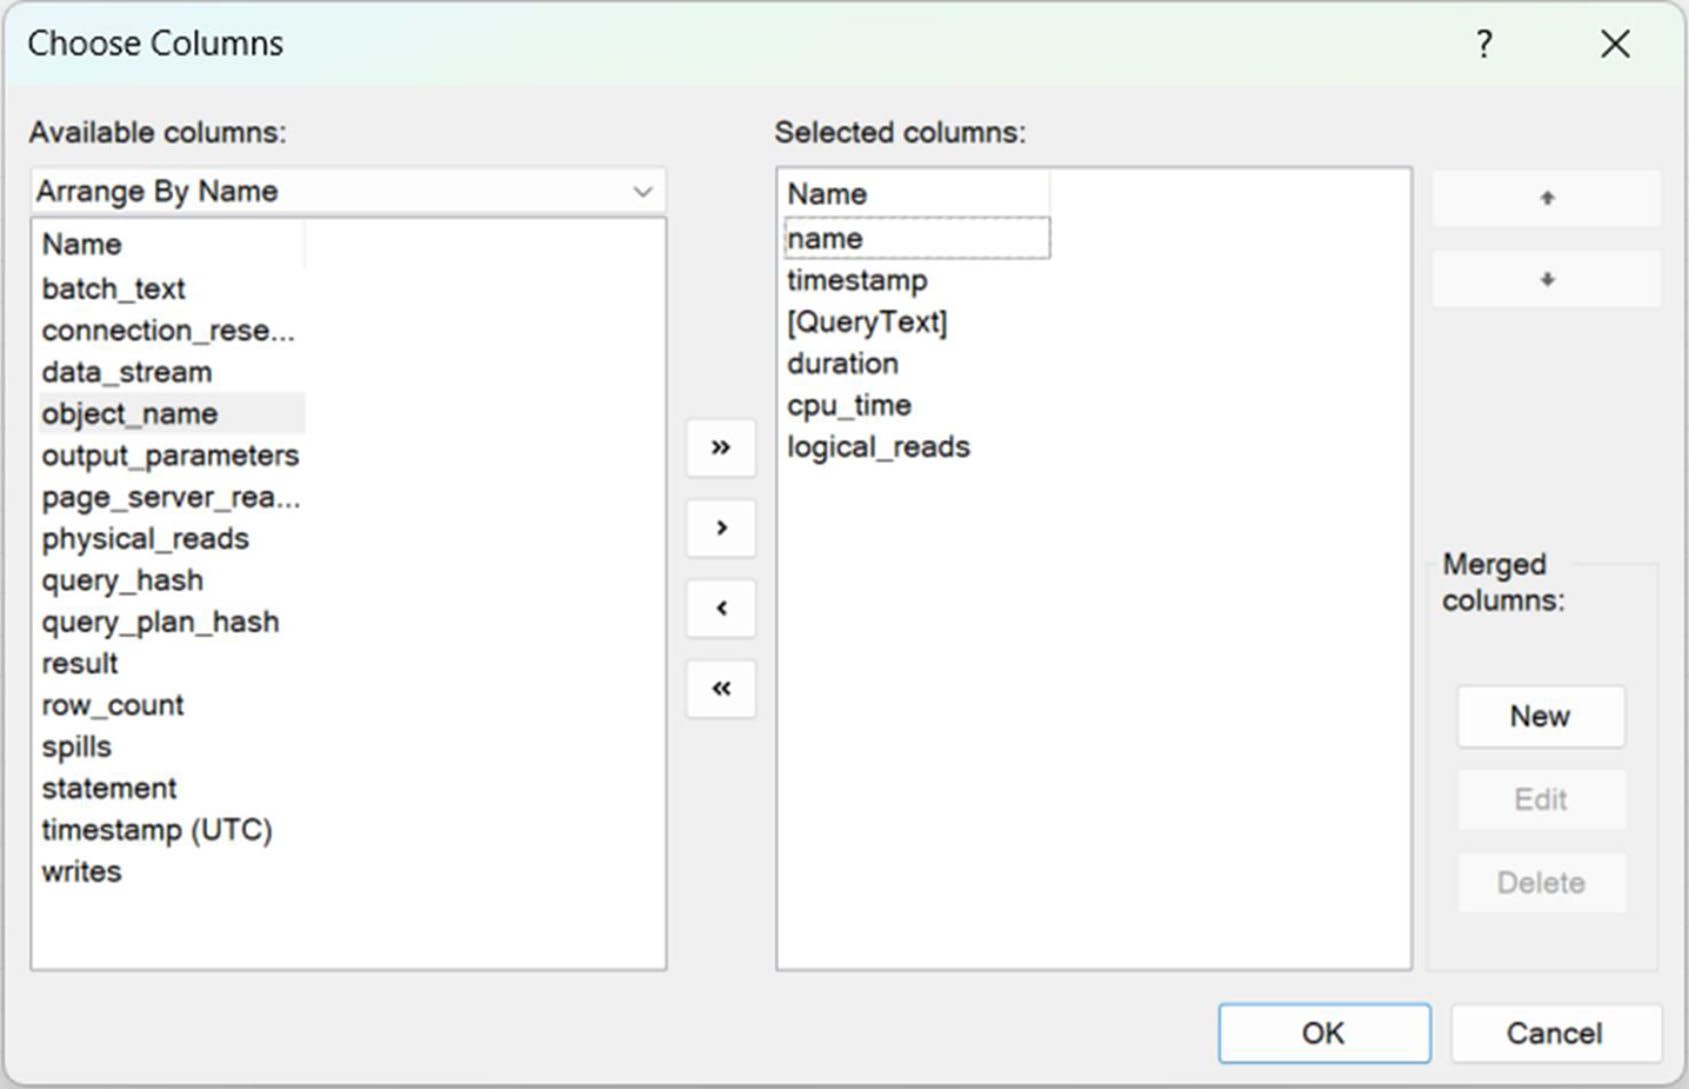
Figure 3-24: Choose Columns window in the Live Data Explorer

Figure 3-25: A new table with the columns selected on display
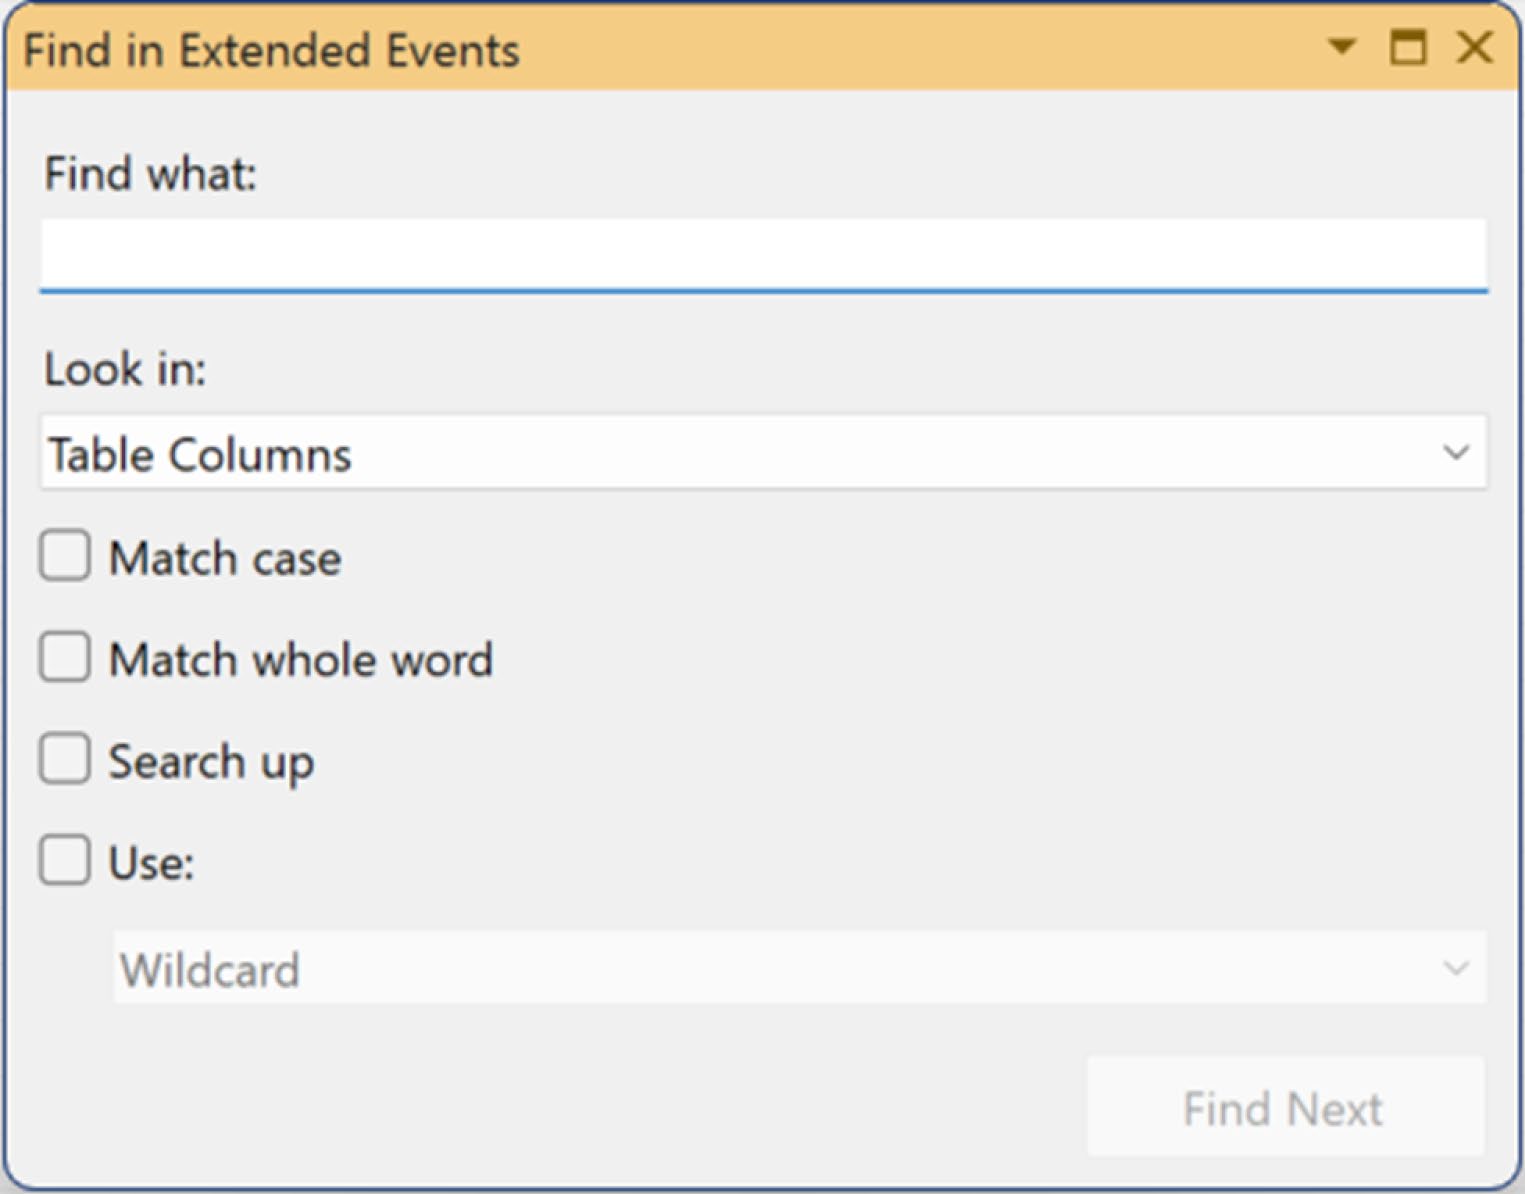
Figure 3-26: Using the search function within the Live Data Explorer
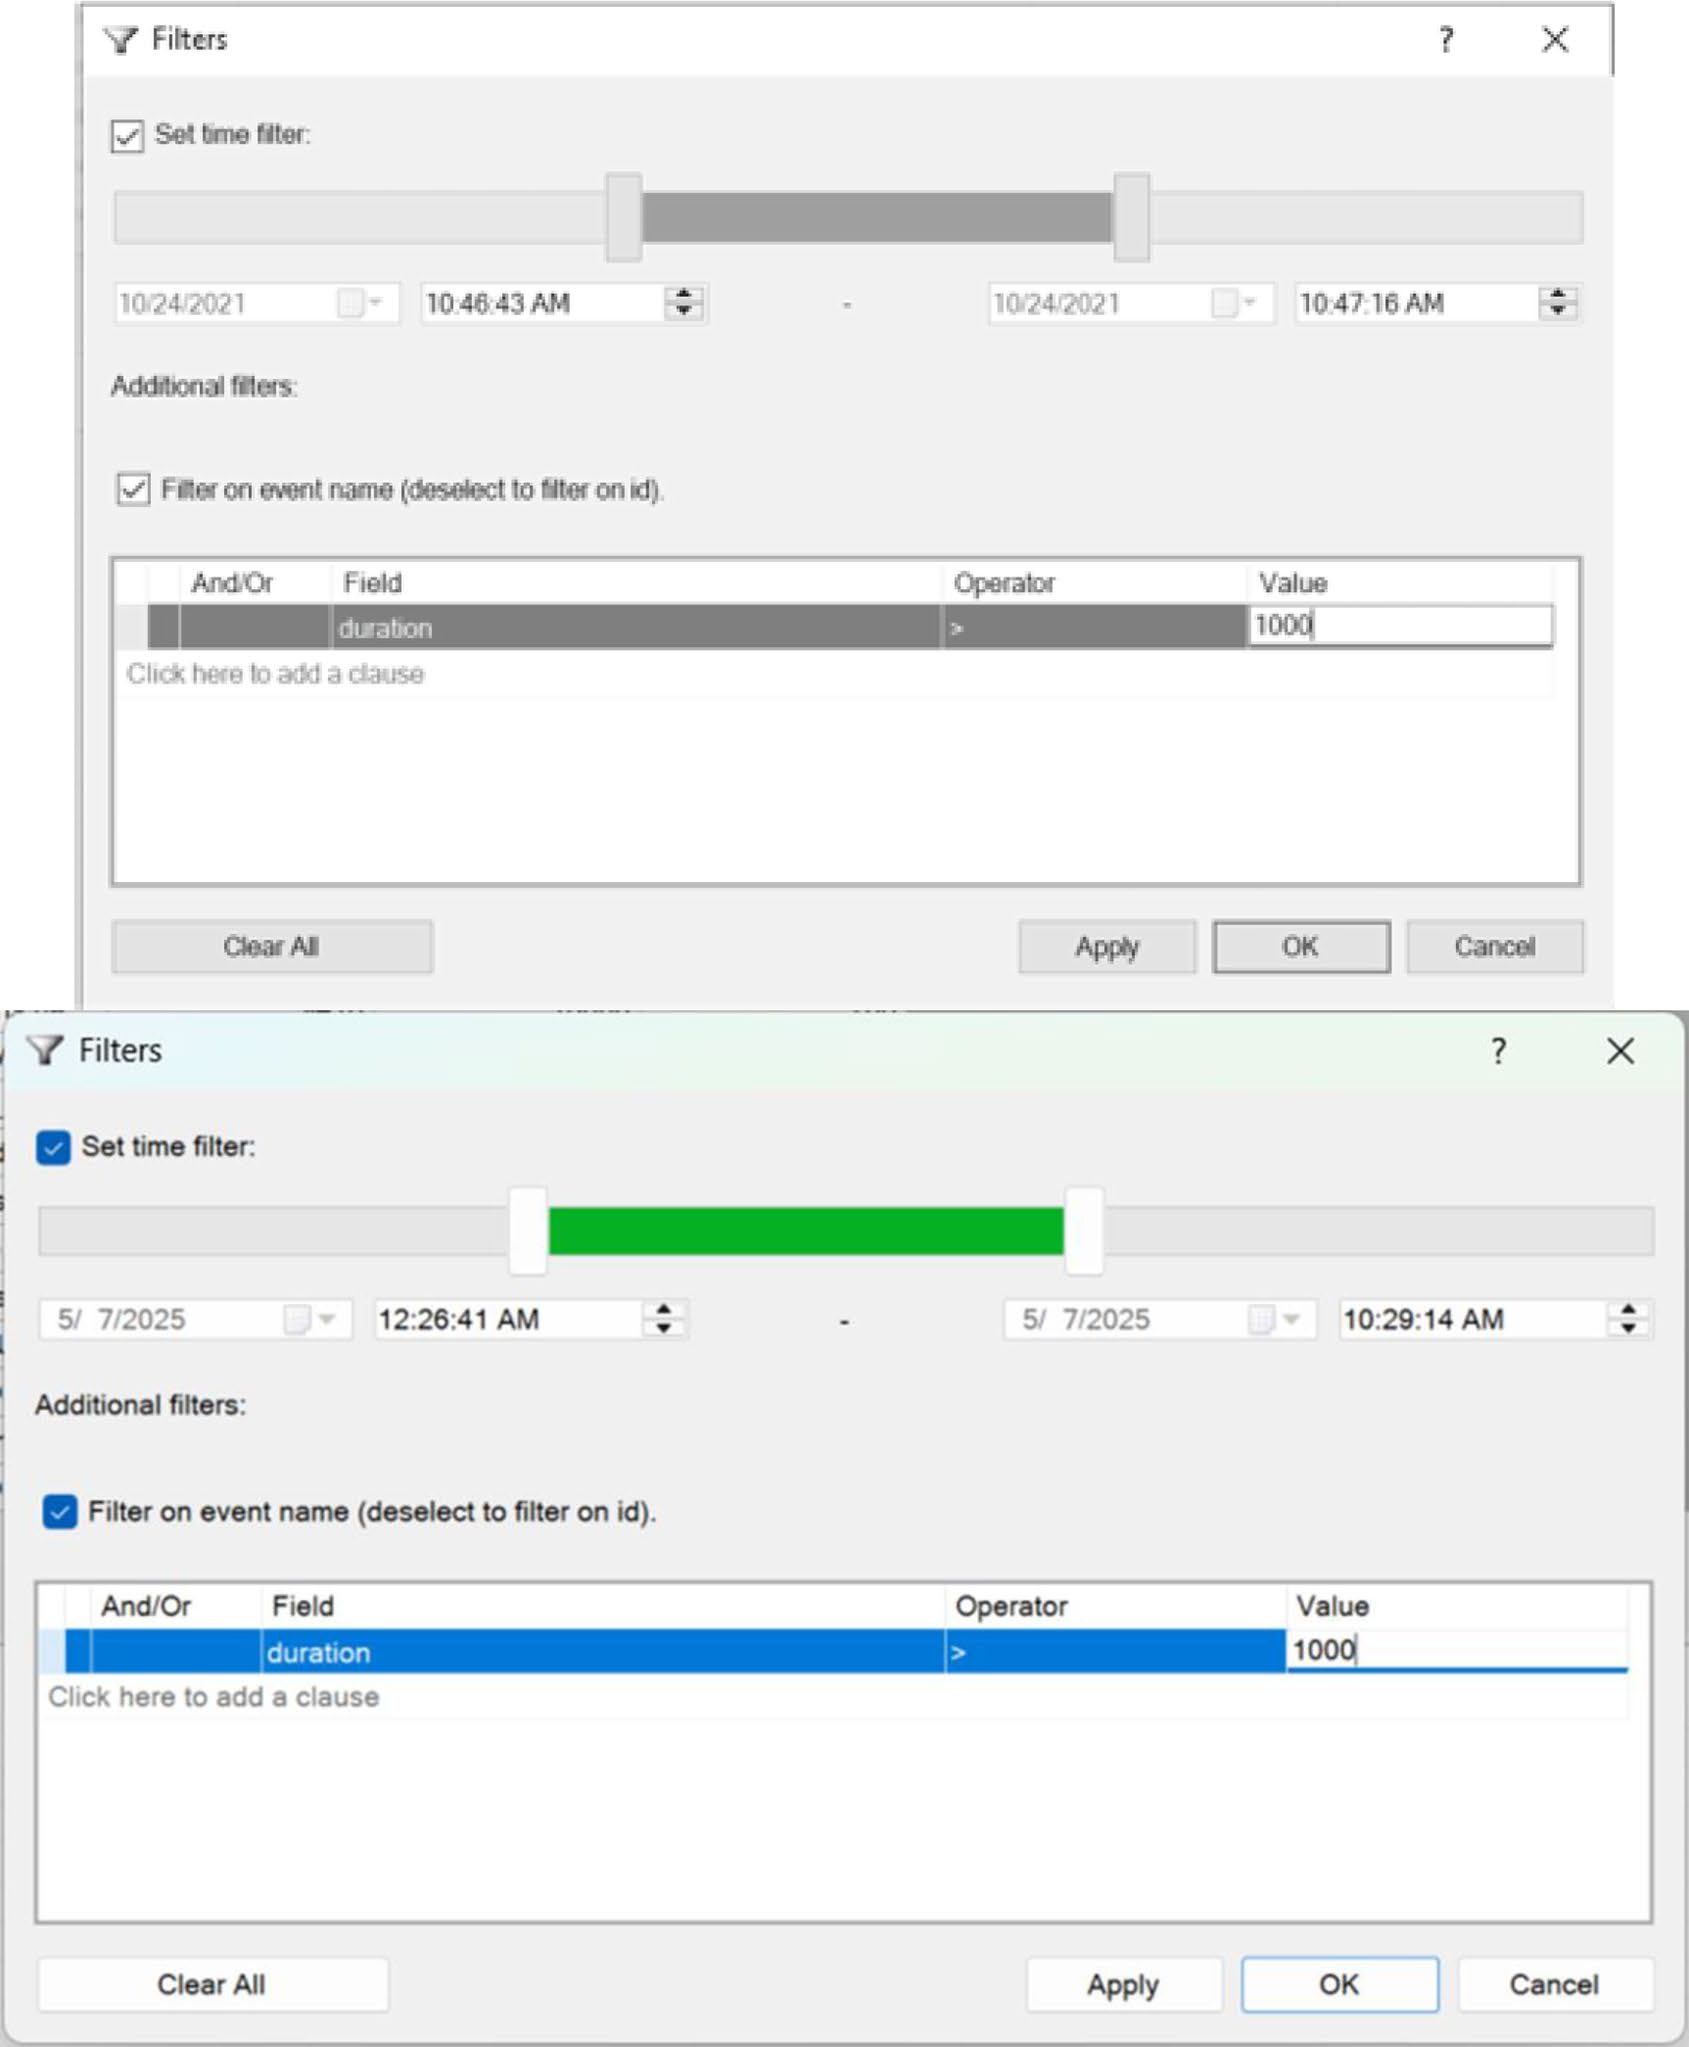
Figure 3-27: Live Data Filters window set with various filters
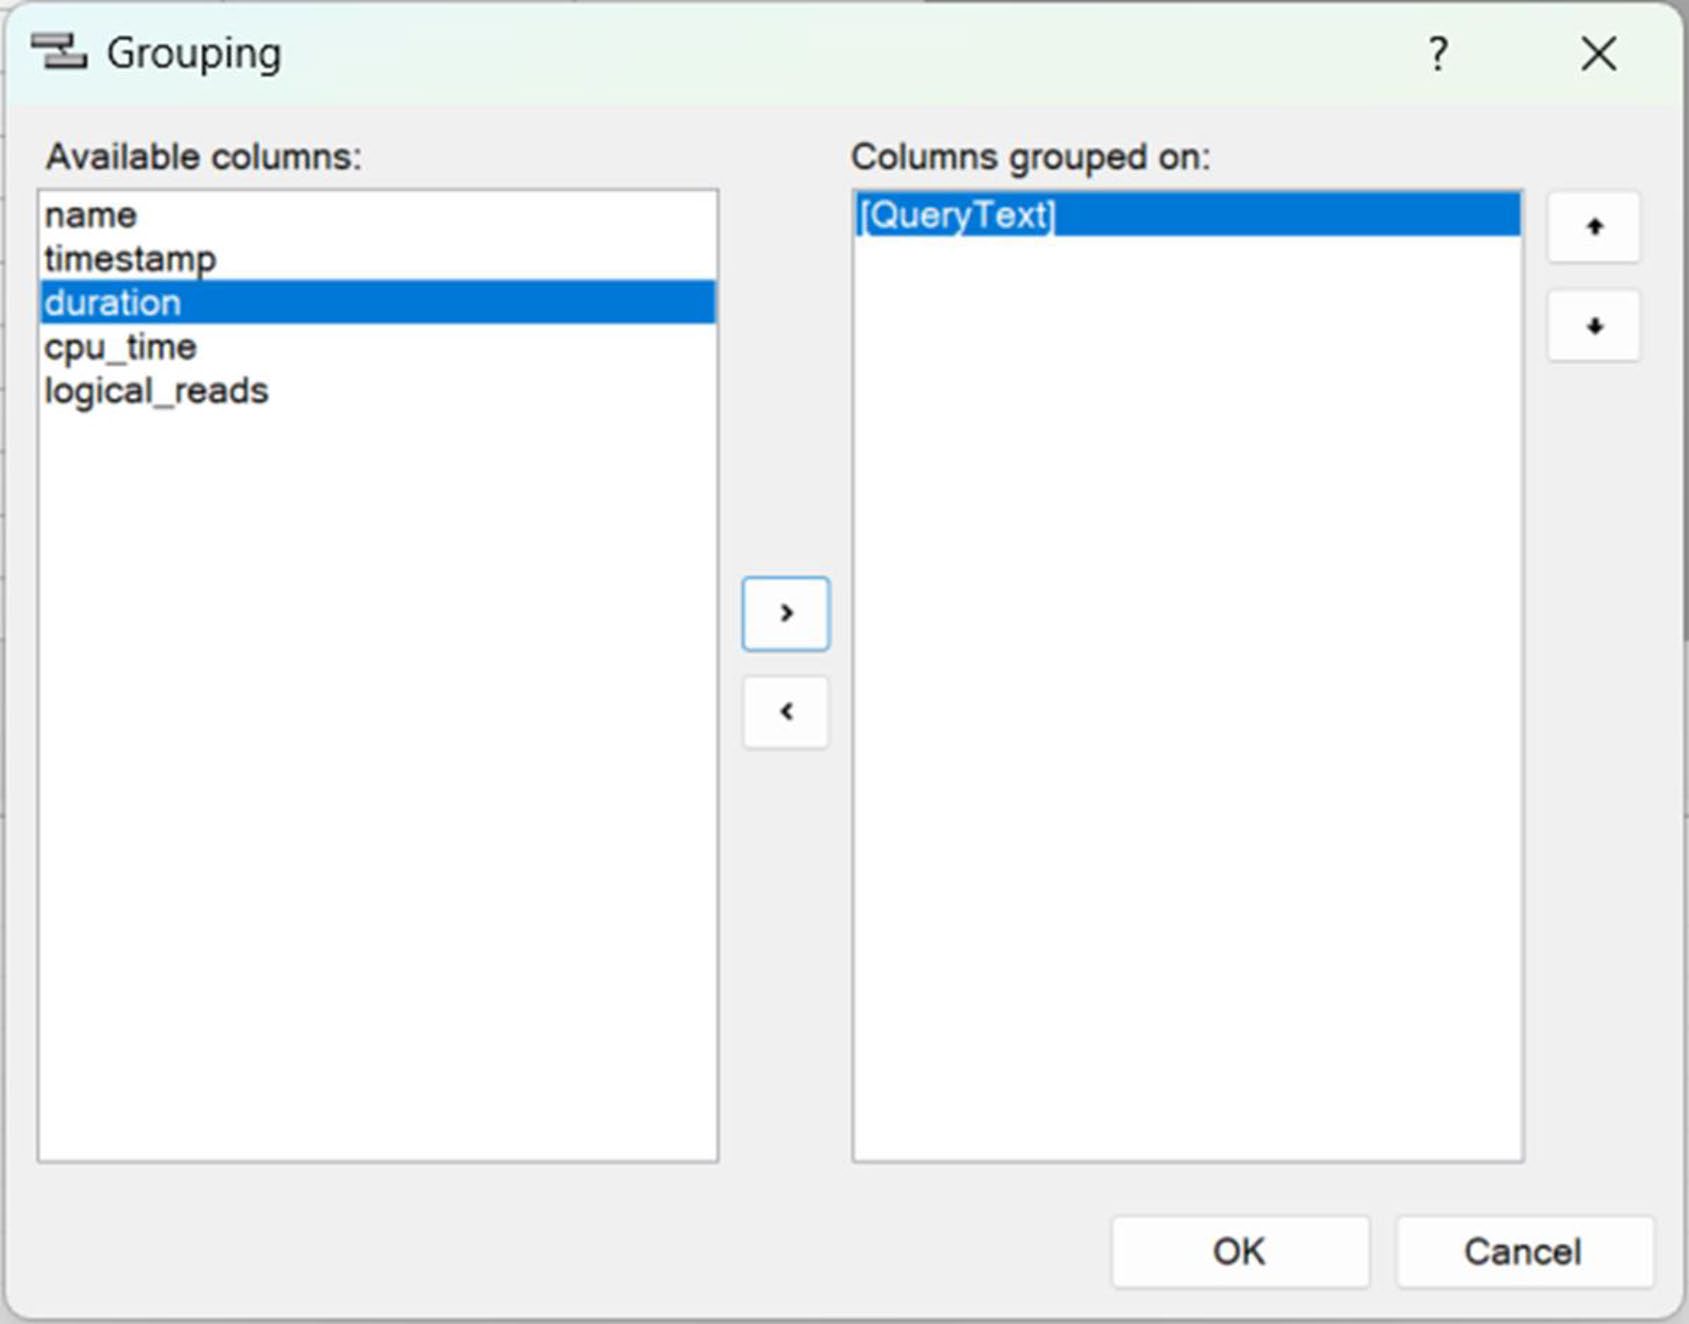
Figure 3-28: Live Data Explorer Grouping window
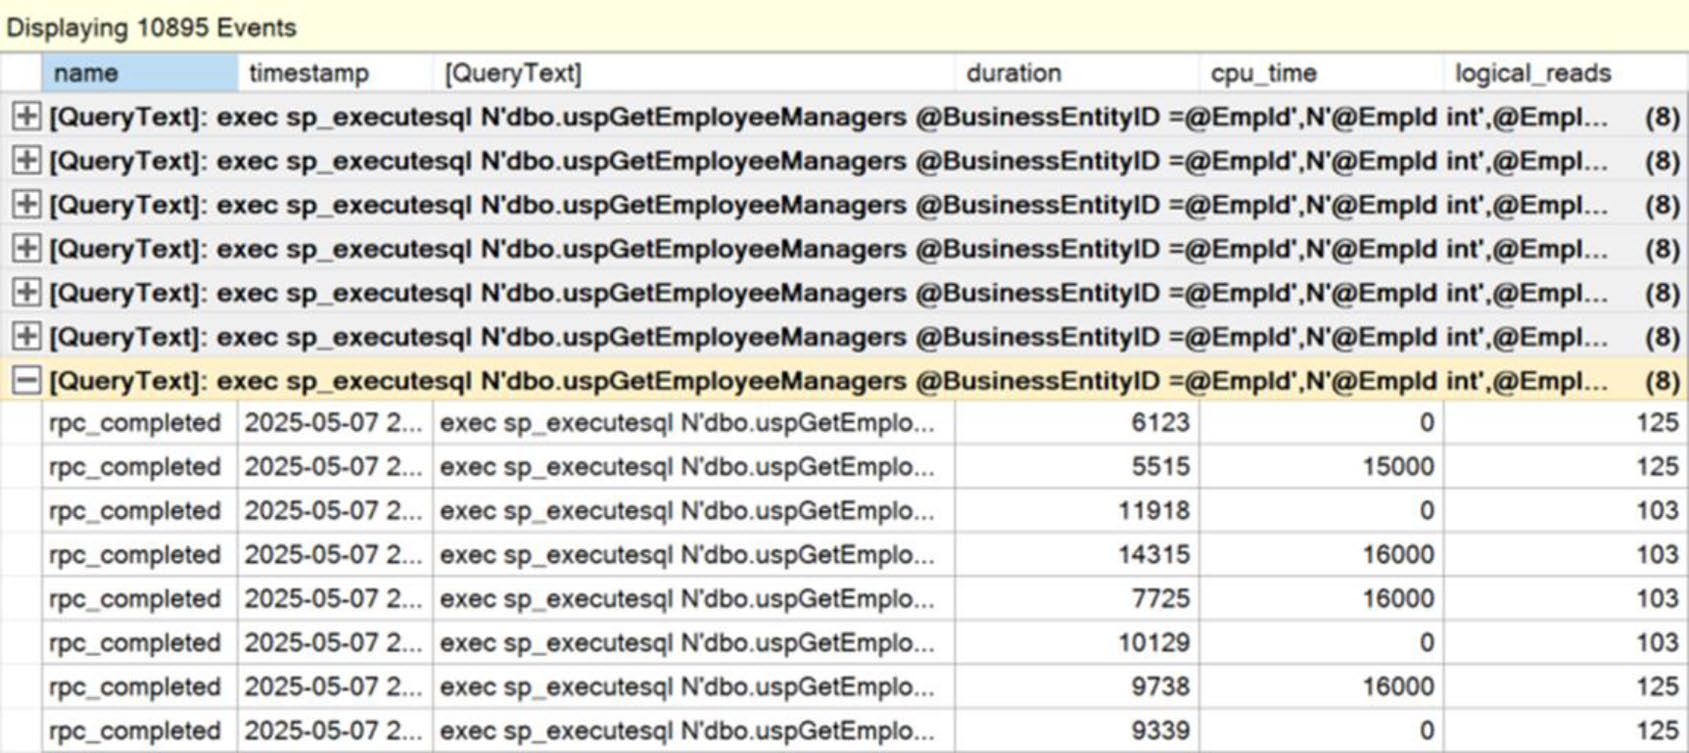
Figure 3-29: Table of the Live Data Explorer grouped by a column
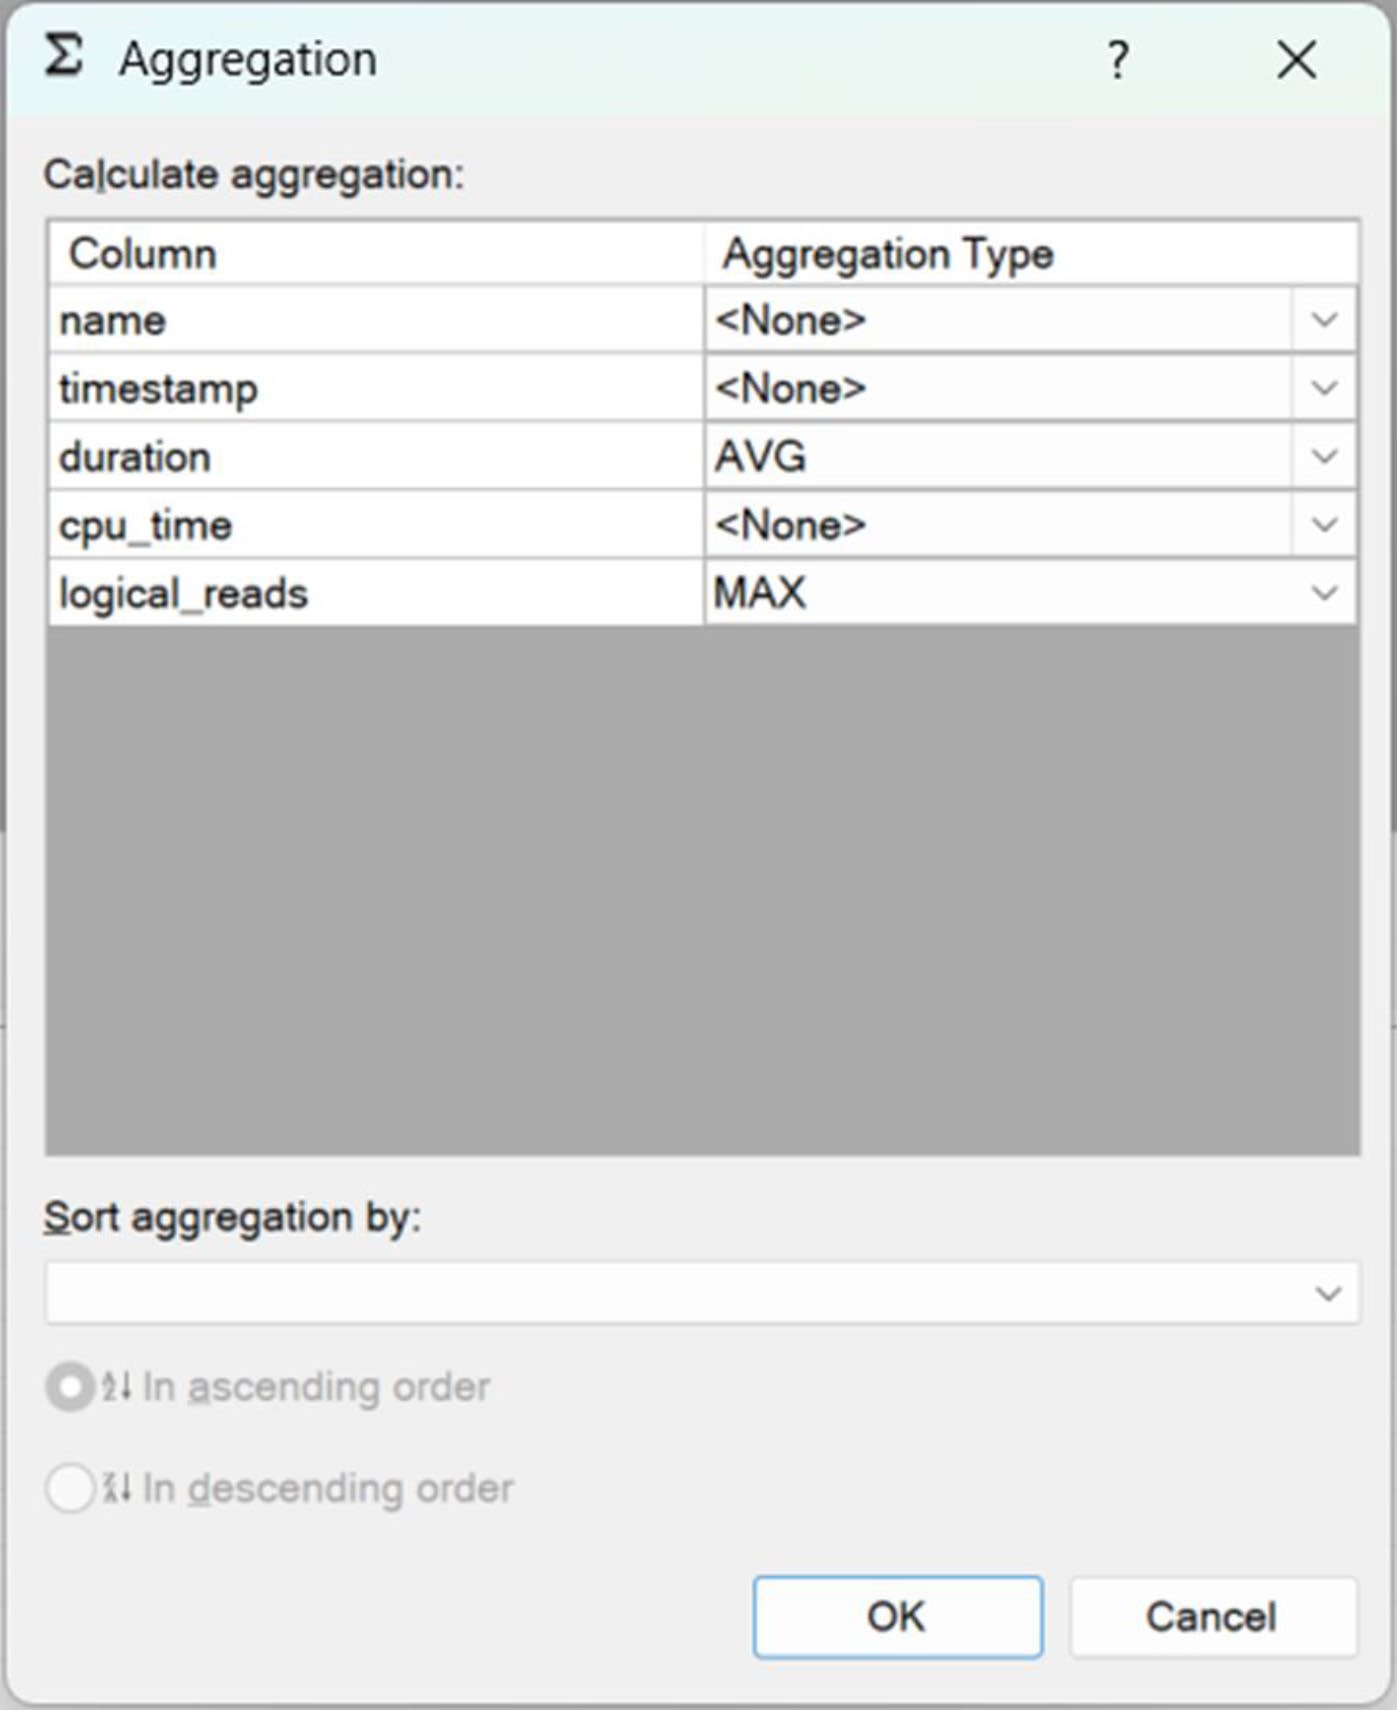
Figure 3-30: Defining aggregation for the Live Data Explorer
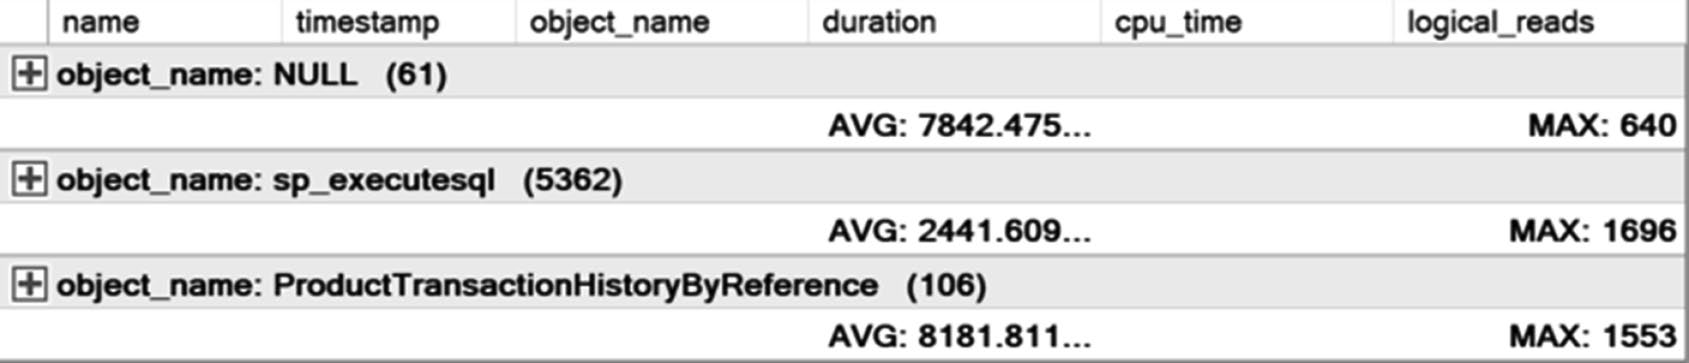
Figure 3-31: Live Data Explorer table showing aggregated values
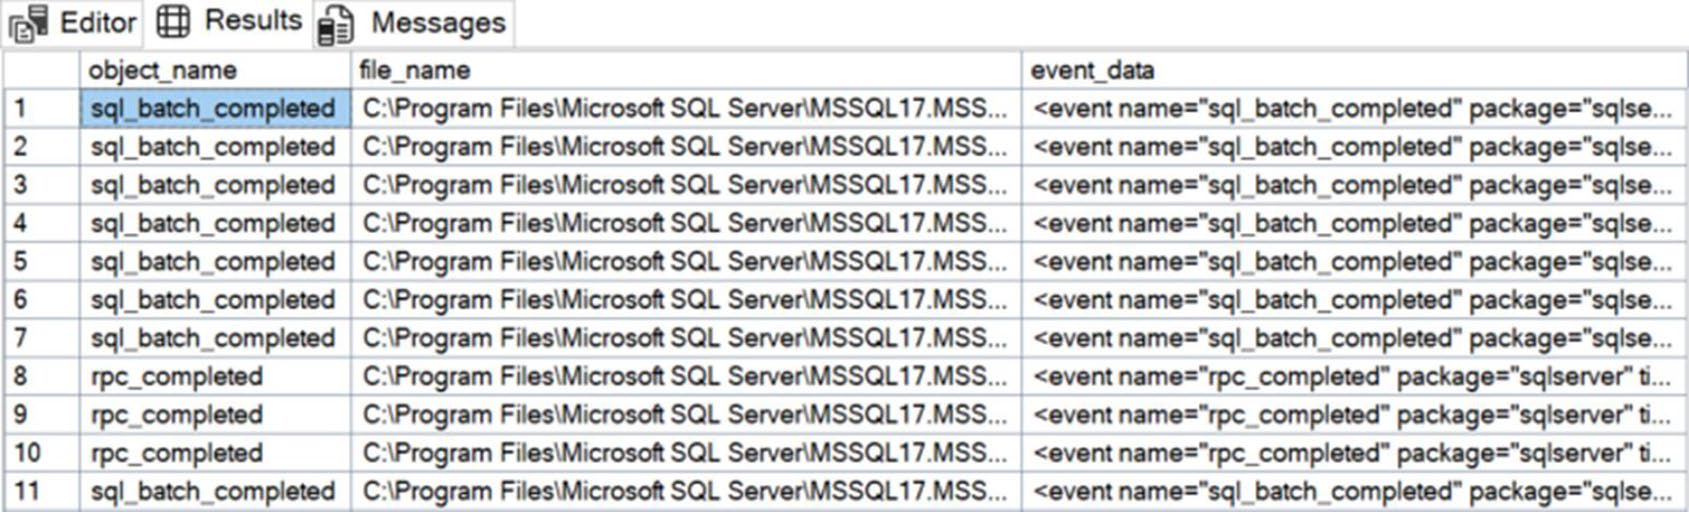
Figure 3-20: Output from querying Extended Event data directly
三個工具的搭配心法#
- DMV:隨時可查,但只能看「現在 + plan cache 還在的最近一段時間」
- Query Store:跨時段比較、找出 plan regression、保存歷史的最佳工具
- Extended Events:單次調校最深入的解析來源,控制細緻、開銷低
平時用 Query Store 與 DMV 監測;遇到具體查詢要深挖時,臨時開一個 Extended Events Session 抓細節,調完關掉。
本章定調#
- 別用 client statistics 這類含網路 / client 因素的方法
- 不要用 Trace / Profiler(除非系統 ≤ 2008)
- 三大工具:DMV(即查)、Query Store(歷史)、Extended Events(細節)
下一章將進入 執行計畫的閱讀與分析——量測之後,下一步就是看計畫挖出問題在哪裡。